
Overview
An infographic is a visual representation of complex data that allows users to interact with the content. Infographics can be designed as images, websites, print material and PDFs and are known for these design features:
- Use pictures to represent words
- Group information by colors
- Cluster information in a static order
- Use extreme color contrast
However, because infographics are visual informational material, they inherently present accessibility barriers to users with visual or many cognitive disabilities. Therefore, infographic designers must design accessibility into an infographic to ensure the content is recognizable to screen readers.
Flyers & Infographics
- Flyers & Infographics in the Panopto video training (use your CSUN username and password to log in)
- Flyers & Infographics Slides (pdf)

- Adding flyers & infographics to Calendar Events
- Infographics Checklist
Canva vs PowerPoint Design
Microsoft PowerPoint offers a quicker way to create accessible event flyers, infographics, posters, or newsletters that include image description (Alt Text), capability to re-arrange logical reading order, built-in accessibility checker, and retains all the structure when exporting to PDF. Learn more about Canva vs PowerPoint Design.
Creating Accessible Infographics
The following resource provides an overview of approaches to creating an accessible infographic and accessibility best practices to keep in mind when designing an infographic.
Image Infographics
Image infographics are the most popular infographic format, however; this format is also the least accessible. A screen reader cannot recognize the content (text) within an image infographic because it is an image. An image Infographic, therefore, requires an alternative method to ensure accessibility. Image infographics require an alternative text description in the form of a transcript. A transcript is simply a full-text version of the infographic that screen readers recognize and is therefore accessible to all users. When an image is displayed on a website, a transcript can be presented in the following ways:
- A transcript can be hidden behind an image. Advanced designers with web development skills can hide the text description of an image using a variety of HTML and CSS methods. However, precaution must be taken when using this approach to avoid inadvertently causing a new accessibility concern.
- A transcript can be displayed below an image infographic. Displaying the description under the infographic gives all users access to the information. An example of this method is available in WebAim’s infographic accessibility tutorials.
- A transcript can be linked. Advanced designers with web development skills can create a new page with the transcript and provide a link to the transcript directly above or below the image infographic. This method also gives all users the opportunity to access the transcript information.
HTML and CSS Infographics
Advanced developers and designers can create infographics using HTML and CSS. HTML/CSS infographics embed the infographic content directly on a webpage. If the HTML and CSS are developed using custom codes to include accessibility, then the infographic becomes accessible to screen readers. In addition, an HTML infographic increases Search Engine Optimization (SEO) whereas an infographic that is an image does not, view example of HTML infographic.
PDF Infographics
Infographics as PDFs are becoming widely popular thanks to their ability to be easily shared across multiple platforms. A PDF infographic can be made accessible if all document accessibility best practices for PDFs are followed. To make an accessible PDF infographic, users require Adobe Acrobat Professional (Pro). Adobe Acrobat Pro allows users to add accessibility markup (tags) and structure that can easily be read by screen readers. For a tutorial on creating accessible PDF through Adobe Acrobat Pro go to UDC’s PDF Documents page.
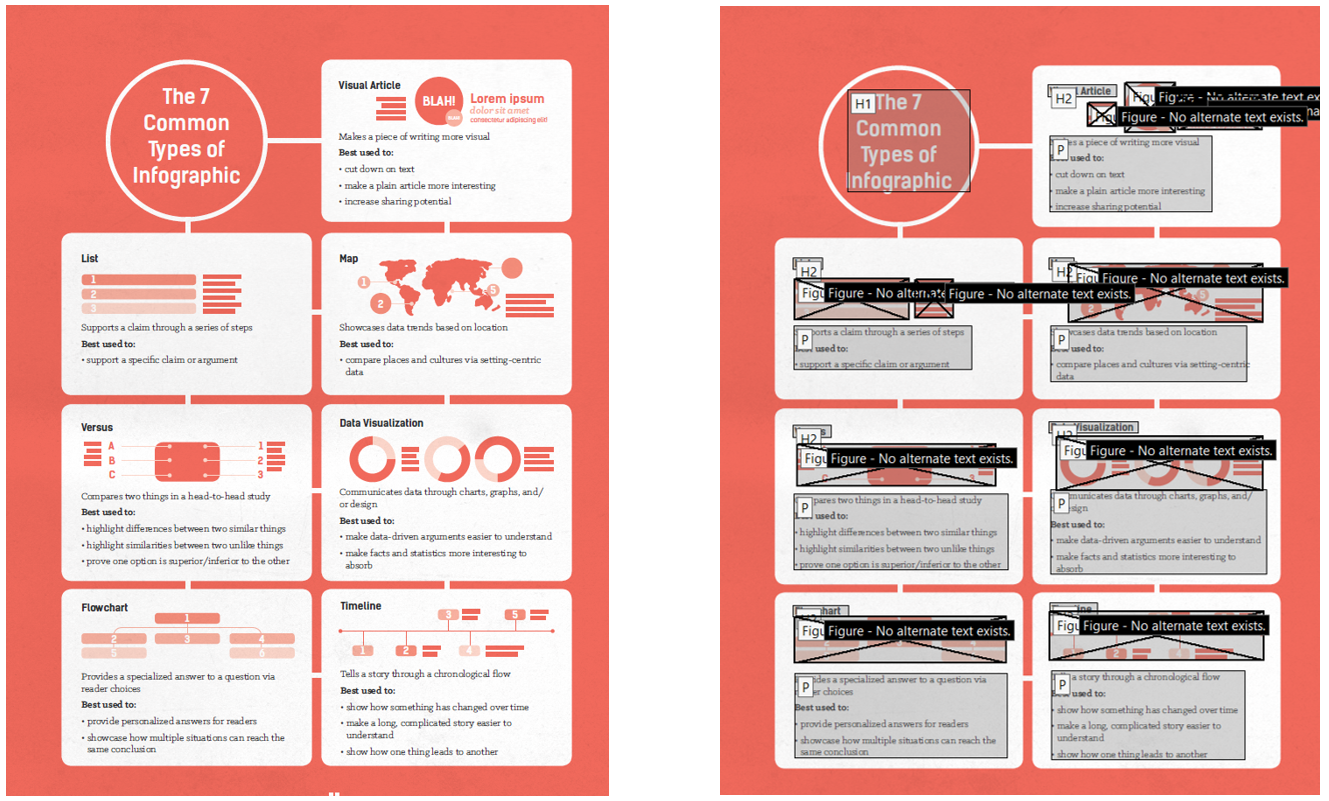
The example below demonstrates a PDF infographic with appropriate accessibility markup. As rule of thumb, a PDF infographic must never be an image and should always have selectable text. This will allow users to accurately markup the PDF with appropriate accessibility tags.
Best Practices
When creating an infographic, designers should always consider the following accessibility best practices:
- Text display: Text should always be clear and easy to understand for maximum reader comprehension. Avoid using difficult to read font, small text and ensure the language and tone in written text is appropriate to ensure the audience remains engaged.
- Images: When images or graphics are included within an infographic, those images must also be described if they convey important meaning or message. For additional support about how to write text descriptions for images, please review Best Practices for Accessible Images.
- Links: If there are links in an infographic, the link text must clearly describe where the link is going to take a user. Do not use link phrases such as “click here” or “read more” and always ensure the link can be easily distinguished to users. Please note: links in an image infographic are not accessible.
- Color contrast: When using color in an infographic, always make sure there is enough color contrast between the foreground content and background content. When the foreground and background colors are too similar, users will have a hard time understanding the information.
- Structure: an infographic must always have a logical structure that includes titles and heading levels.
- Mobile Display: Avoid making large infographics as they cannot be properly displayed on mobile devices.
Also consider the following criteria when creating an infographic, courtesy of WebAIM:

Accessible Web Version of WebAim Infographic
