
| Project Expenditures | Amount |
|---|---|
| Direct Cost | $20,956,133 |
| Indirect Cost | $2,846,843 |
| Total | $23,802,976 |
| Indirect Cost Recovery Rate | Percent |
|---|---|
| Recovered Indirect Cost in % of Direct Cost | 13.58% |
| FY 2010/2011 Period 1-12 July 1, 2010 - June 30, 2011 | Current Year FY 2010/2011 | Previous Year FY 2009/2010 | |||||||
| Actual vs. Budget | Annual Budget | Same Period | |||||||
| Actual | Budget | Diff. | Budget | Achiev. | Actual | Diff. | |||
| ($000) | ($000) | ($000) | in % | ($000) | in % | ($000) | ($000) | in % | |
| 1. Sponsored Programs Activity | |||||||||
| 1.1Direct Cost | 20957 | 16637 | 4320 | 26% | 16637 | 126% | 16940 | 4017 | 24% |
| 1.2Indirect Cost | 2847 | 2169 | 678 | 31% | 2169 | 131% | 2443 | 404 | 19% |
| 1.3Total SP-Cost | 23804 | 18806 | 4998 | 27% | 18806 | 127% | 19383 | 4421 | 24% |
| 2. Indirect Cost Rate | |||||||||
| 2.1Average IDC-Rate | 13.6% | 13.0% | 13.0% | 14.4% | |||||
| 3. Net Available to Campus | |||||||||
| 3.1Recovered IDC (=1.2) | 2847 | 2169 | 678 | 31% | 2169 | 131% | 2443 | 404 | 19% |
| 3.2- TUC-Service Fee (3.9%) | 928 | 733 | 195 | 27% | 733 | 127% | 756 | 177 | 24% |
| 3.3- Expense Dept. 24100 (TUC-SP) | 547 | 534 | 13 | 2% | 534 | 102% | 476 | ||
| 3.4- Expense Dept. 24150 (ORSP) | 95 | 93 | 2 | 2% | 93 | 102% | 91 | ||
| 3.5- Add. SP Reserve (10%) | 81 | (81) | -100% | 81 | 0% | ||||
| 3.6 =Net Available to Campus | 1277 | 728 | 549 | 75% | 728 | 175% | 1120 | 157 | 12% |
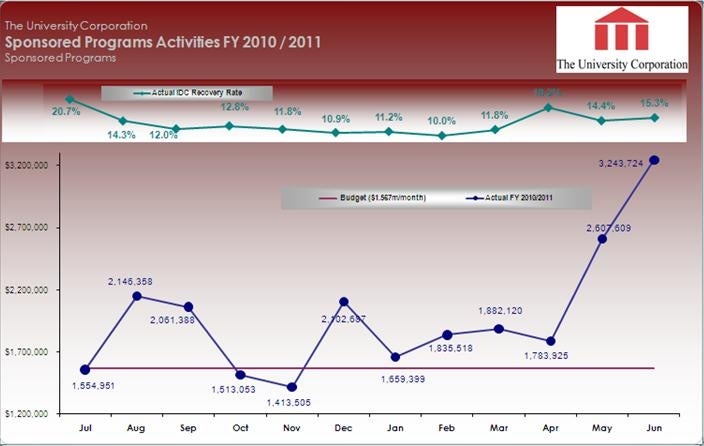
| Monthly Expenditures, FY 2010/2011 | July | August | September | October | November | December | January | February | March | April | May | June | Total |
|---|---|---|---|---|---|---|---|---|---|---|---|---|---|
| Actual | |||||||||||||
| Direct | 1,255,642 | 1,888,551 | 1,789,003 | 1,321,501 | 1,231,994 | 1,887,563 | 1,619,672 | 1,669,980 | 1,681,164 | 1,506,570 | 2,274,897 | 2,830,856 | 20,957,394 |
| Indirect | 266,504 | 268,482 | 220,195 | 172,221 | 149,743 | 206,178 | 166,974 | 166,553 | 197,981 | 275,174 | 327,451 | 429,388 | 2,846,843 |
| Total | 1,522,146 | 2,157,032 | 2,009,198 | 1,493,722 | 1,381,737 | 2,093,741 | 1,786,647 | 1,836,533 | 1,879,145 | 1,781,744 | 2,602,348 | 3,260,244 | 23,804,237 |
| IDC-Rate | 21.2% | 14.2% | 12.3% | 13.0% | 12.2% | 10.9% | 10.3% | 10.0% | 11.8% | 18.3% | 14.4% | 15.2% | 13.6% |
| Budget | 1567200 | 1567200 | 1567200 | 1567200 | 1567200 | 1567200 | 1567200 | 1567200 | 1567200 | 1567200 | 1567200 | 1567200 | 1567200 |
| Difference | -45,054 | 589,832 | 441,998 | -73,478 | -185,463 | 526,541 | 219,447 | 269,333 | 311,945 | 214,544 | 1,035,148 | 1,693,044 | 4,997,837 |
| Granting Agency / Contractual Partner | Direct Cost | Indirect Cost | Percent | Total | Pecent |
|---|---|---|---|---|---|
| Federal Government | 11,673,929.45 | 2,074,411.92 | 72.9 | 13,748,341.37 | 57.8 |
| State Government | 3,406,995.89 | 242,247.40 | 8.5 | 3,649,243.29 | 15.3 |
| Local Government | 4,423,102.17 | 408,880.54 | 14.4 | 4,831,982.71 | 20.3 |
| Private Non-Profit | 1,142,772.24 | 76,684.66 | 2.7 | 1,219,456.90 | 5.1 |
| Private For-Profit | 287,636.47 | 42,207.48 | 1.5 | 329,843.95 | 1.4 |
| Other | 21,696.38 | 2,411.47 | 0.1 | 24,107.85 | 0.1 |
| Total | 20,956,132.60 | 2,846,843.47 | 100.0% | 23,802,976.07 | 100.0% |
| Original Source of Funds | Direct Cost | Indirect Cost | Percent | Total | Percent |
|---|---|---|---|---|---|
| Federal Government Grants and Contracts (including pass-through from non-federal grantors) | 17,190,246.41 | 2,578,424.26 | 90.6 | 19,768,670.67 | 83.1 |
| State Government Grants and Contracts | 1,643,136.99 | 41,901.47 | 1.5 | 1,685,038.46 | 7.1 |
| Local Government Grants and Contracts | 1,600,303.03 | 185,622.14 | 6.5 | 1,785,925.17 | 7.5 |
| Other | 522,446.17 | 40,895.60 | 1.4 | 563,341.77 | 2.4 |
| Total | 20,956.132.60 | 2,846,843.47 | 100.0% | 23,802,976.07 | 100.0% |
| Original Source of Funds - By Agency (including pass-through from non-federal grantors) | Total | Percent |
|---|---|---|
| Federal | ||
| US Department of Health and Human Services (DHHS) | 6,204,691 | 26.07 |
| US Department of Education (ED) | 7,205,261 | 30.3 |
| National Science Foundation (NSF) | 3,852,178 | 16.2 |
| US Department of Justice (DOJ) | 385,956 | 1.6 |
| US Department of Defense (DOD) | 972,415 | 4.1 |
| Corporation for National and Community Service | 32,510 | 0.1 |
| US Department of Energy (DOE) | 264,947 | 1.1 |
| National Aeronautics and Space Administration (NASA) | 281,979 | 1.2 |
| National Endowment for the Humanities | 80,883 | 0.3 |
| US Department of Commerce (DOC) | 14,138 | 0.1 |
| US Department of the Interior (DOI) | 38,561 | 0.2 |
| Department of Agriculture | 73,149 | 0.3 |
| Department of Housing and Urban Development | 115,722 | 0.5 |
| Department of Labor | 115,056 | 0.5 |
| Department of Homeland Security | 25,272 | 0.1 |
| US Department of Treasury | 68,878 | 0.3 |
| US Department of Transportation | 37,072 | 0.2 |
| Total Federal Funds | 19,768,671 | 83.1 |
| State | 1,685,038 | 7.1 |
| Other | 2,349,267 | 9.9 |
| Total | 23,802,976 | 100.0% |
| Total Project Expenditures by Account | Total | Percent | |
|---|---|---|---|
| Salaries & Wages | 10,388,940.79 | ||
| Benefits | 1,855,116.31 | ||
| Total Personnel Cost | 12,244,057.10 | 51.4% | |
| Supplies | |||
| - Office Supplies | 193,323.69 | ||
| - Computer Supplies | 3,884.30 | ||
| - Operational Supplies | 26,522.93 | ||
| - Instructional-Book Supplies | 83,698.82 | ||
| 307,429.84 | |||
| Program Costs | 657,852.80 | ||
| Printing and Photocopy | 35,642.61 | ||
| Publication Charges | 6,880.56 | ||
| Postage | 3,061.43 | ||
| Equipment Lease | 138,652.55 | ||
| Equipment Rental | 3,530.46 | ||
| Facility Rental | 19,864.53 | ||
| Hospitality | 46,934.50 | ||
| Program Food Costs | 684.90 | ||
| Dues | 380.00 | ||
| Subscriptions | 1,505.42 | ||
| Advertising | 3,686.73 | ||
| Professional & Contract Services | |||
| - Professional Services | 13,011.50 | ||
| - Contract Services | 919,736.86 | ||
| - Audit Services | -196.30 | ||
| - Management Services | 7,226.71 | ||
| - Computer Systems Support | 33,472.06 | ||
| - Web-Online Services | 619.34 | ||
| - Parking | 3,056.72 | ||
| - Training-Development Svcs | 57,989.04 | ||
| 1,034,915.93 | |||
| - Subcontractor Svcs-University | 546,894.15 | ||
| - Subcontractor Svcs-Non Profit | 88,704.66 | ||
| - Subcontractor Svcs-For Profit | 169,139.56 | ||
| Subcontracts | 804,738.37 | 3.4% | |
| - Travel | 424,508.60 | ||
| - In State Travel | 59,006.31 | ||
| - Out of State Travel | 20,228.49 | ||
| - Out of Country Travel | 171,263.59 | ||
| - Seminar-Conference Fee | -27,477.02 | ||
| - Ground Transportation | 17,990.50 | ||
| - Meals | 43,502.40 | ||
| Travel Expenses | 709,022.87 | ||
| Telephones | 49,501.17 | ||
| Answering Services | 20,792.77 | ||
| Pager Services | 512.84 | ||
| Electricity | 19,676.17 | ||
| Equip-Facility R and M | 93,643.70 | ||
| - Stipends-Student | 2,920,628.65 | ||
| - Stipends-Non-Student | 215,000.33 | ||
| - Tuition-Books | 468,683.15 | ||
| - Student Housing | 80,252.46 | ||
| - Grant Event Costs | 9,800.92 | ||
| - Participant Incentive Award | 12,110.00 | ||
| - Participant Travel | 263,940.35 | ||
| Stipends | 3,970,415.86 | 16.7% | |
| - Expendable Equipment | 210,255.26 | ||
| - Minor Capital Equipment | 93,915.82 | ||
| - Major Capital Equipment | 478,578.41 | ||
| Equipment | 782,749.49 | ||
| Total Operational Cost | 8,712,075.50 | 36.6% | |
| Total Direct Cost | 20,956,132.60 | 88.0% | |
| Indirect Cost | 2,846,843.47 | 12.0% | |
| Total Cost | 23,802,976.07 | 100.0% |
| Expenditures by College | Total | Percent |
|---|---|---|
| College of Science and Mathematics | 7,721,938.91 | 32.4% |
| College of Education | 7,101,820.82 | 29.8% |
| University Administration | 2,516,458.63 | 10.6% |
| College of Social and Behavioral Sciences | 2,374,812.80 | 10.0% |
| College of Business and Economics | 978,603.10 | 4.1% |
| College of Engineering & Computer Science | 742,846.09 | 3.1% |
| National Center on Deafness | 1,044,992.72 | 4.4% |
| College of Health & Human Development | 582,753.07 | 2.4% |
| College of Arts, Media, & Communication | 312,969.13 | 1.3% |
| College of Humanities | 425,780.80 | 1.8% |
| Total | 23,802,976.07 | 100.0% |
| Expenditures | Total | Percent |
|---|---|---|
| College of Science and Mathematics | 1,360,045.56 | 47.8% |
| College of Education | 392,958.69 | 13.8% |
| University Administration | 391,126.67 | 13.7% |
| College of Social and Behavioral Sciences | 266,463.25 | 9.4% |
| College of Business and Economics | 104,716.22 | 3.7% |
| College of Engineering & Computer Science | 106,855.21 | 3.8% |
| National Center on Deafness | 94,999.34 | 3.3% |
| College of Health & Human Development | 82,307.14 | 2.9% |
| College of Arts, Media, & Communication | 31,435.76 | 1.1% |
| College of Humanities | 15,935.63 | 0.6% |
| Total | 2,846,843.47 | 100.0% |