
Table of Contents
Transactions
Portfolio Holdings
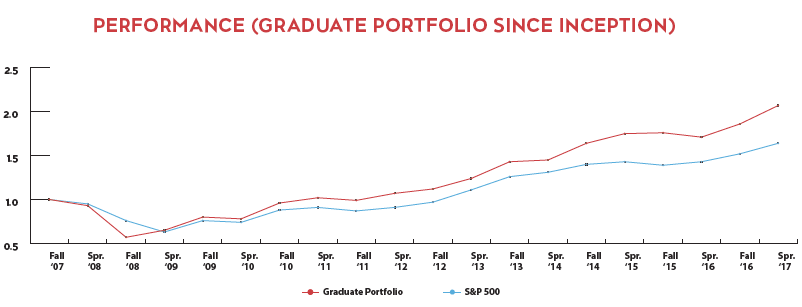
Return Performance
 Dear Friends of CSUN’s Nazarian College Graduate Programs,
The David Nazarian College of Business and Economics’ nationally recognized MBA Program emphasizes experiential learning wherein students’ acquisition of business knowledge and skills is enhanced through active engagement with actual business and organizational situations. An exemplar of our practice is the Nazarian MBA Student Investment Fund which allows MBA students the opportunity to manage a portfolio of more than $1 million on behalf of a California State University, Northridge endowment.
Under the supervision of Professor of Finance Vincentiu Covrig, Ph.D., CFA, students conduct research and analysis, then pitch recommendations to their classmates. They also learn from industry leaders who serve as guest speakers and mentors. This engaged learning develops more than theoretical knowledge; students simultaneously gain practice in the ambiguities, unexpected events, and fortuitous fortunes (and losses) that occur. Furthermore, students experience considerable satisfaction as the portfolio consists of monies that directly benefit the campus, faculty and students. Students develop soft skills in presentation, pitching, negotiation and teamwork in this collaborative, hands-on learning environment.
The Nazarian MBA is annually recognized by U.S. News & World Report as among the nation’s best part-time programs. Year after year, the David Nazarian College of Business and Economics is named as a Best Business School by Princeton Review. Its accreditation by the premier accrediting organization, AACSB International, places it within the top five percent of global business degree-granting institutions.
The outstanding faculty publish in top journals and engage in professional activities in their fields, staying current in both theory and application. Recent achievement of a $25 million capital campaign, including a naming gift by David Nazarian, as well as by Harriet and Harvey Bookstein for the college’s home in Bookstein Hall, demonstrates alumni recognition and support.
CSUN is a regional leader in higher education. As one of the most diverse universities in the country, it serves as a social and economic elevator where individuals rise — and through them, so does Greater Los Angeles and beyond. Through academic rigor, experiential learning and diversity, the David Nazarian College of Business and Economics is changing the face of business.
Sincerely,
Deborah Cours, Ph.D.
Interim Dean
David Nazarian College of Business and Economics

FROM THE FACULTY
On behalf of the MBA Student Investment Management class of 2017 at California State University, Northridge, we are pleased to present the Academic Year 2016-17 Report.
The Student Investment Management class is one of the special opportunities for CSUN finance students. In this class, students actively manage part of the university’s endowment, and through that, further develop and sharpen their investing skills and knowledge. The class provides a number of other benefits to our students and the program, such as career opportunities for our students, closer ties to the financial community, and increased awareness and brand recognition for our programs. The students spent the first part of the semester acquiring the research tools (such as Bloomberg and other statistical software) and reviewing the existing portfolio, identifying over- and under-represented sectors, and familiarizing themselves with the general economic and capital markets’ conditions. Then they used stock screeners and thorough research to identify the stocks to be sold from, or added to, the portfolio to achieve investment goals. During the semester the students also went through a rigorous and intensive equity valuation and portfolio management training, based on the topics covered in the CFA exams.
June 2016 to May 2017 was a very good 12-month period for the MBA Student Investment Fund. On May 31, 2017 the value of the portfolio was $1,109,110, compared to $912,808, an increase of roughly 22 percent. We outperformed the 15-percent increase for the benchmark Standard and Poor’s 500 index, even though our portfolio had roughly 10 percent in cash. Both U.S. and foreign markets rose during this period, buoyed by very low inflation and interest rates, record lows in unemployment rate, strong U.S. and developing countries growth, and despite domestic political turmoil and two Federal Reserve interest rate increases. As of May 2017, the S&P 500 had trailing price/earnings ratio of around 18 with valuation levels above historical average. Some of the best performers in our portfolio were Apple, Boeing, Arista Networks and NetEase, and the underperformers were Akamai Technologies and Altria.
The class would like to thank Todd Kaltman, Managing Director at Duff & Phelps, and Mr. Andrew Crowell, Vice Chairman of D.A. Davidson & Co. Individual Investor Group., for sharing their knowledge and experiences with the class this year.
Sincerely,
Vicentiu Covrig , Ph.D., CFA - Instructor
John Zhou, Ph.D., MBA - Department Chair, Finance