Page Description
The following page is a three column layout with a header containing the search CSUN function. Page sections are identified with headers. The footer contains update, contact and emergency information.

USING GIS TO TARGET OUTREACH FOR LADWP CUSTOMER REBATE PROGRAMS
This Project
This project is a collaborative effort between California State University, Northridge and the San Fernando Valley Green Team. Using geographical information systems (GIS) and spatial statistical analyses, we examine the participation in various electricity saving programs in Los Angeles Department of Water and Power and their effectiveness.
Resources:
Chapter 4 Results of Analyses
4.1 Residential Energy Consumption
4.2 Conmmercial Energy Consumption
4.3 Clusters of Hot SPots and Cool Spots
4.1 Residential Energy Consumption
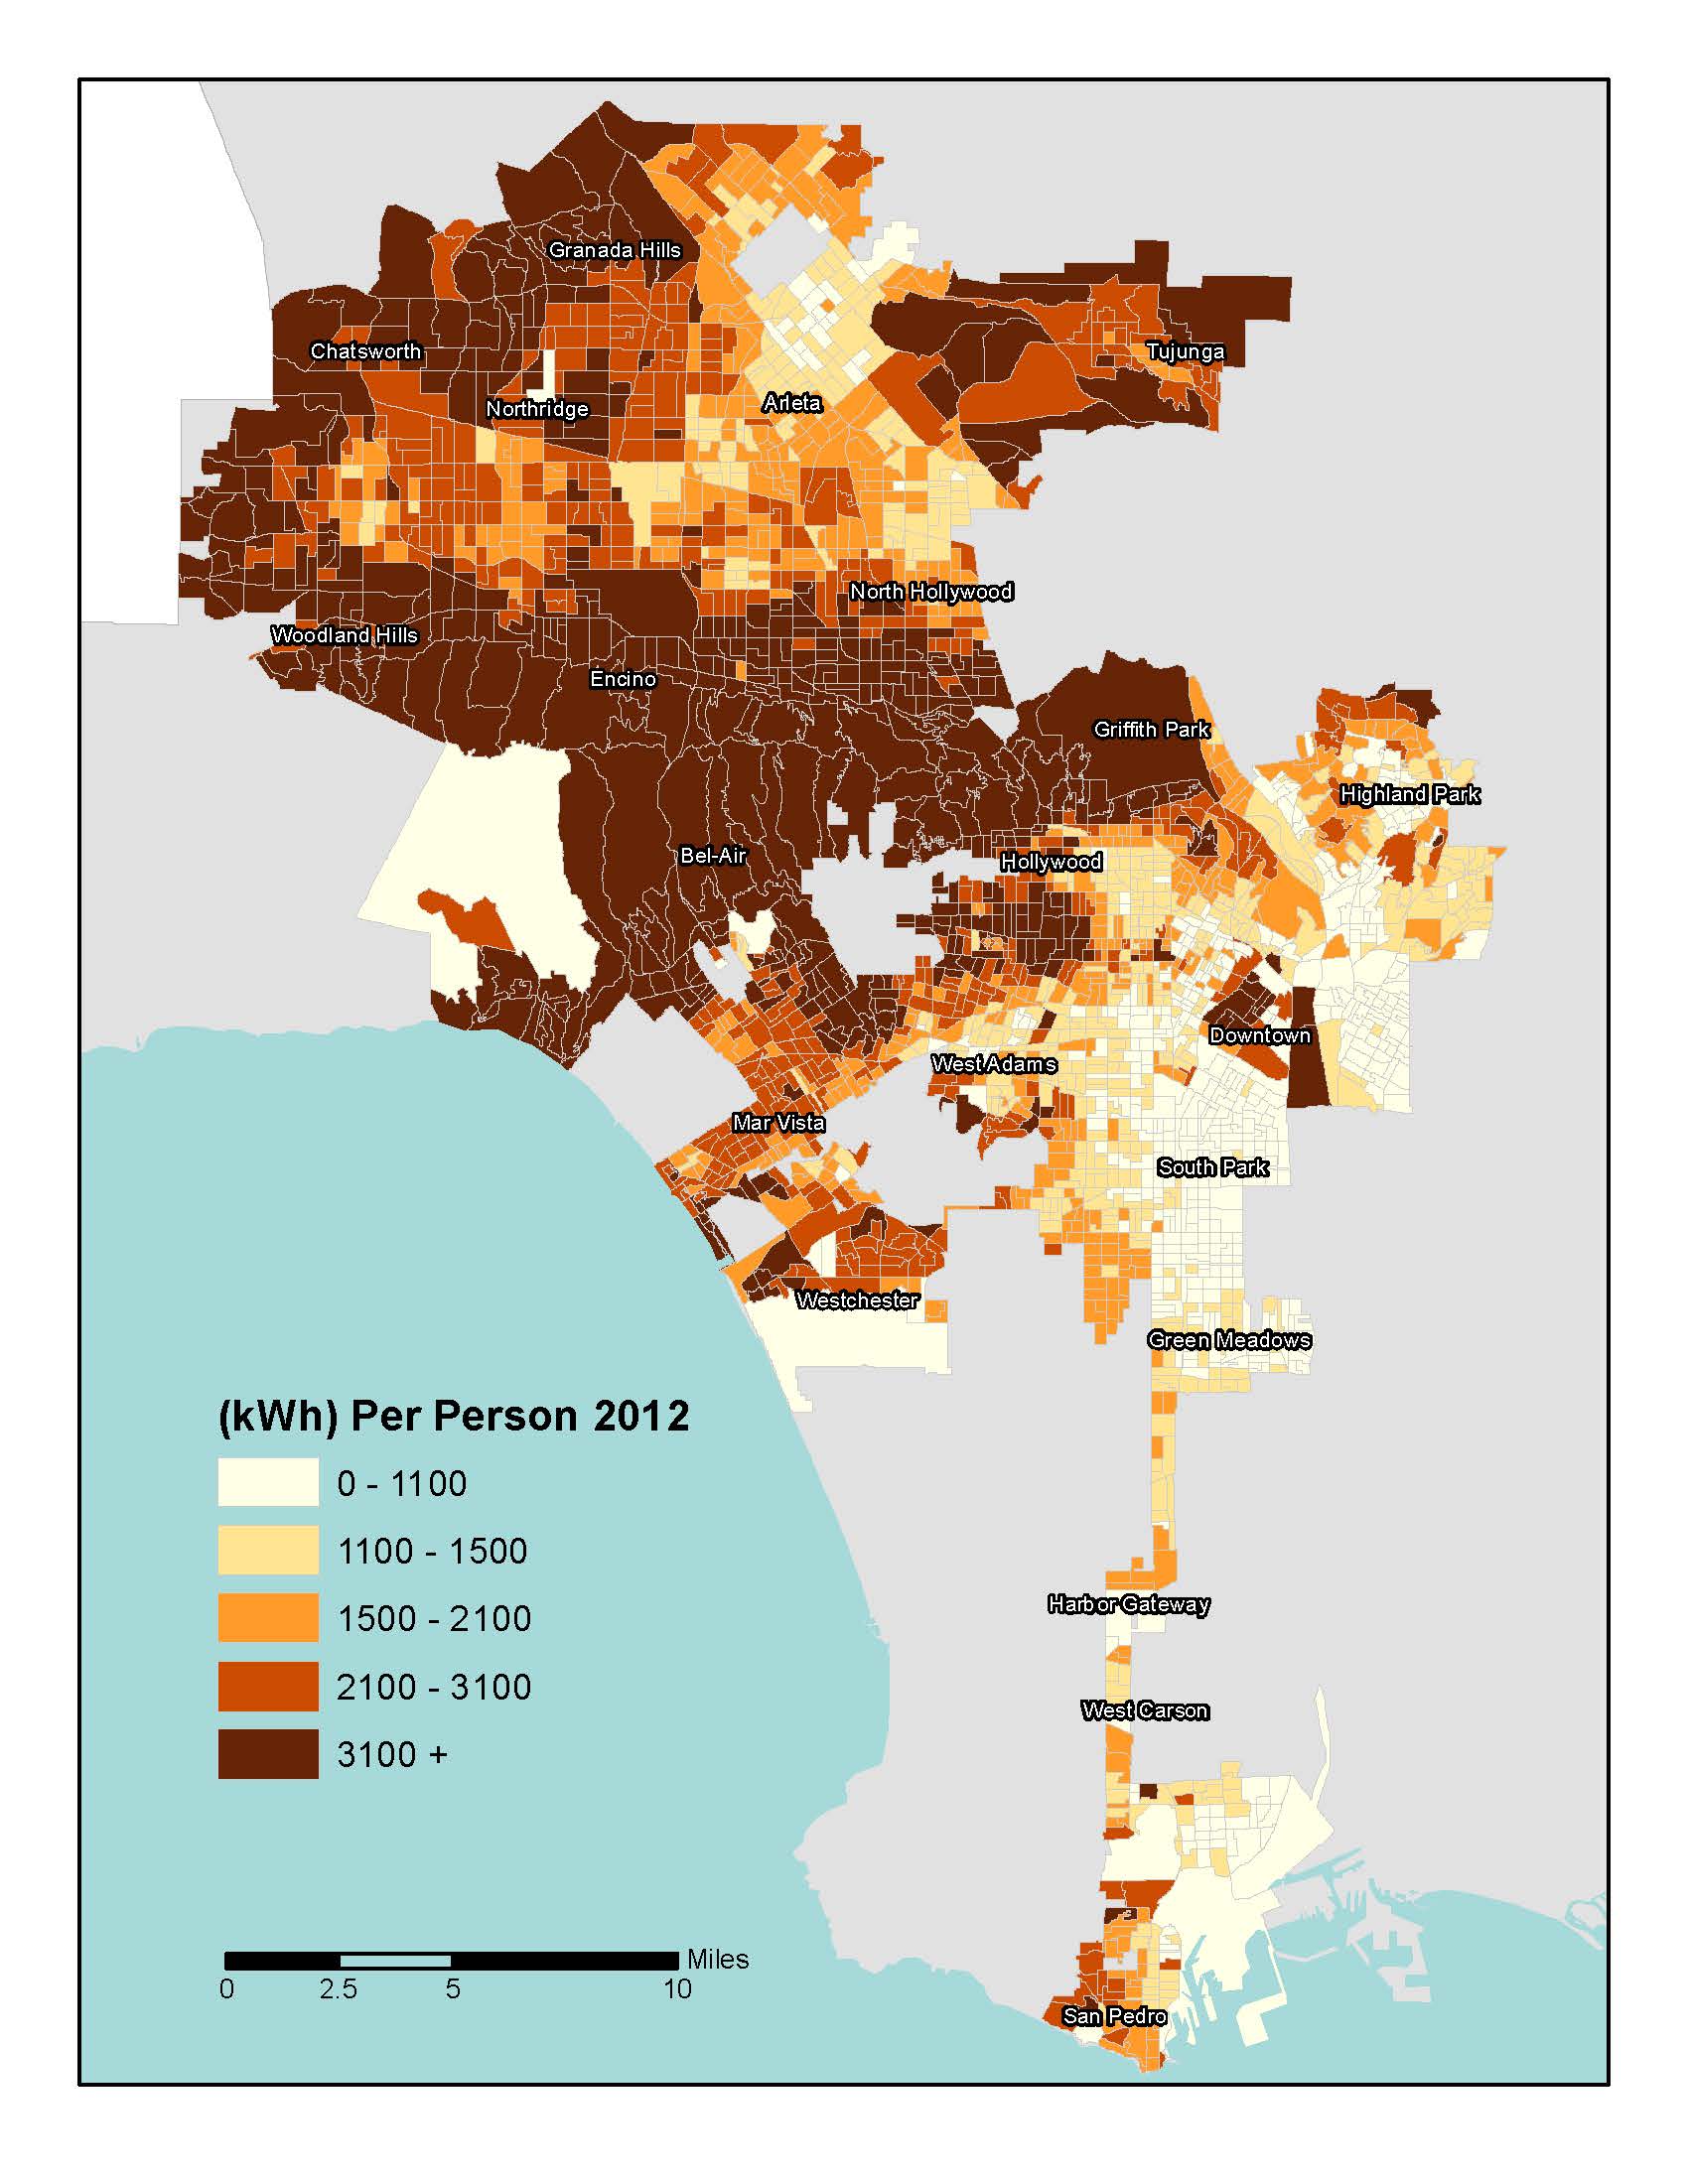
Residential energy consumption is highly uneven in geography, as we discussed earlier (Maps 2.17-2.20). How to explain such geographical differences? In this part, we explore the potential social-economic factors as well as LADWP energy efficiency programs. Table 4.1 Descriptive Statistics of Variables (Residential) list the major socio-economic variables that are examined in this project from household size, median household income, ethnicity composition, household types, and aging population percentages in different housing structures. The data reveals that an average resident consumed about 2,100 KWH in 2010 and the number increased to 2,200 in 2012. However, median consumption is much lower (1,700 and 1,800 respectively). The differences between average consumption and median consumption indicate that a number of block groups’ consumption is much higher than the average. Indeed, the highest average consumption reached more than 24,000 KWH per person, more than 10 times of average. The relative energy efficiency index (REEI) also improved slightly by about 1% during the period from 2009 to 2012.
Table 4.1 Descriptive Statistics of Variables (Residential)
Table 4.2 Comparison of Residential Energy Consumption Per Person 2010
Table 4.3 Comparison of Residential Energy Consumption Per Person 2012
Table 4.2 Comparison of Residential Energy Consumption Per Person 2010 and Table 4.3 Comparison of Residential Energy Consumption Per Person 2012 show the results of simple comparison among neighborhoods regarding their energy consumption and socio-economic factors. It is clear that residents consume more electricity in neighborhoods that are wealthier, with higher percentages of White and Asian, home owners, more senior citizens, and living in detached houses than those in less wealthy, with more Black, Hispanic, renters, fewer senior residents, and living in multiple-units. We also found that electricity consumption per person is lower for people living in households with more family members than those in households with fewer members. For example, the average electricity consumption for neighborhoods that have income above the median was nearly 3,000 kWh or about 9 kWh a day while an average resident in neighborhoods with income less than the median consumed nearly half as much. The average electricity consumption for neighborhoods with more than half of its population as White was more than 3,000 kWh in 2012, while neighborhoods with more than half its residents as Hispanic consumed only 1,300 kWh. Clearly, electricity consumption is affected by socio-economics factors. What is interesting is the finding that residents on average consumed more energy in neighborhoods where resident participation in the LADWP Customer Rebate Program experienced faster growth than those experienced slower growth of participation. Such results suggest that residents in more affluent neighborhoods are consuming more energy and are more likely to participate in the Customer Rebate Program.
Table 4.4. Comparison of Residential Energy Consumption Change 2009-2012
Table 4.4 Comparison of Residential Energy Consumption Change 2009-2012 reports the consumption electricity growth rate during 2009 and 2012. It is interesting to note that significant variances exist in different neighborhoods. Electricity consumption per person declined by 0.3% percent for neighborhoods with higher income , while electricity consumption per person grew by 0.67%for those neighborhoods below median household income. It is also interesting to note that electricity consumption per person for neighborhoods with majority of Asian residents declined by 1.70% while electivity consumption per person for neighborhoods with the majority of other ethnicities grew by different degrees (0.10% for White to 0.75% for Hispanics). Electricity consumption per person for neighborhoods with more senior residents declined as well.. Furthermore, it is also interesting to note that neighborhoods experienced declined electricity consumption per person with higher than average people in both multiple-units and detached housing. Finally, The results clearly demonstrated that neighborhood with more active participation in the Customer Rebate Program did reduce their energy consumption per person while those with less active participation showed 0.68% growth during 2009-12.
Map 4.1 Residential Relative Energy Efficiency Index (REEI) 2009-2012Map 4.1 Residential Relative Energy Efficiency Index (REEI) 2009-2012 shows the distribution of Relative Energy Efficiency Index 2009-2012 in City of Los Angeles. Clearly, areas in the northwest Valley (Porter Ranch, Granada Hills, Chatsworth, Woodland Hills and Northridge), the strips in the northeast Valley (Tujunga and Sherman Oaks), the Santa Monica Mountain (Encino and Griffith Park), North east of Downtown, and South Park witnessed the greatest improvement in electricity efficiency. In comparison, neighborhoods in the center and northeast (Arleta and Pacoima) parts of the Valley, the Downtown area, and northeast of the Los Angeles Harbor have shown decreased REEI.
Table 4.5 Regression Analysis for Residential REEI 2009-12
Table 4.5 Regression Analysis for Residential REEI 2009-12 reports the results from the regression analyses. Originally, we included all the socio-economic factors listed in Table 4.1. However, most of the variables are highly correlated with each other. In the end, we only chose those variables that are relatively independent and show Variance Influence Factor (VIF) lower than 5 and with high low tolerance so that we can avoid the multicollinearity problem which could lead to difficulty in interpreting the results. The results show that percentage of Asian population, renters, senior population, and percentage of detached homes all have significant and positive impact on the residential relative energy efficiency index between 2009 and 2012. For example, with one more percent of residents above 55 years or above, REEI will improve by 0.1% between 2009 and 2012. That is: neighborhoods with aging population improve their energy efficiency in comparison to similar neighborhoods with younger population. This is easy to interpret since senior populations are more likely to be conservative in electricity usage. Similarly, Asians are more likely to save electricity in comparison to other ethnicities. Similarly, neighborhoods with more people in renter-occupied and detached housing are more likely to improve their electricity efficiency.
4.2 Conmmercial Energy Consumption
This section will focus on commercial electricity consumption. Table 4.6 Descriptive Statistics of Variables (Commercial) shows the basic statistics on the different variables used in the analyses of commercial electricity consumption. The * denotes that this is the percent of block groups with a given energy efficiency program. Clearly some programs such as Commercial Lighting Efficiency Offer, Customer Rebate Program, and Refrigeration Program, have been adopted across the city; more than 30% of block groups, while other programs such as Clothes Washers Program and Consumer Performance Program showed modest adoption. In comparison, Chiller Efficiency Program only exhibited very small implementation: 2.8%. Table 4.6 also reveals that the other land use category contributes the largest share (27.9%) to urban commercial land use, while agriculture, commercial, manufacturing, and public land use only account for very small porter of urban land use. In addition, Table 4.6 demonstrates that commercial electricity consumption grew only by about 1% between 2009 and 2012.
Table 4.7 Comparison of for Commercial REEI 2009-2012
Table 4.7 Comparison of for Commercial REEI 2009-2012 compares the Commercial REEI with land use and whether or not a block group has a given LADWP commercial electricity program. It is noteworthy that neighborhoods with above median land use in agriculture and public show slight improvement in REEI (1.09) than those under the median level (1.08). It is also interesting to note that neighborhoods with more active participation in LADWP Commercial Energy Programs experienced more improvement in electricity efficiency (1.09) than those with other neighborhoods (1.07) between 2009 and 2012, while neighborhoods with above median land use in manufacturing, commercial and other categories experienced less improvement in electricity efficiency (1.03 vs 1.09, 1.06 vs. 1.09, and 1.07 vs 1.08 respectively).
Table 4.8 Regression Analysis for Commercial REEI 2009-2012
Table 4.8 Regression Analysis for Commercial REEI 2009-2012 reports the results from the regression analyses. In addition to the land use variables, we included the different LADWP electricity programs to examine if they are effective in helping improve commercial electricity efficiency. Among the land use variables, manufacturing land use reduces the REEI while public land use improves the REEI significantly in the statistical sense, though other land use did not seem to have significant influence on REEI. For the individual programs, Commercial Lighting Efficiency, Consumer Performance Program, and Refrigeration Program have improved the REEI significantly while other programs such as Clothes Washers Program, Customer Rebate Program did not have significant effect. When we included all the program variables in the final model, Commercial Lighting Efficiency and Consumer Performance Program still show significant positive effect on REEI, though the Refrigeration Program did not show significant impact anymore. Such differences deserve further analyses in the future.
4.3 Clusters of Hot SPots and Cool Spots
In this section, we report the results from cluster analyses, using spatial statistical modelling which was discussed in the Data and Methodology section. Map 4.1 Residential Relative Energy Efficiency Index (REEI) 2009-2012 shows neighborhoods residential electricity efficiency. It is interesting to note that the same areas that have shown higher energy consumption (Map 2.20) also have shown higher REEI; and that they have improved electricity efficiency between 2009 and 2012. Map 4.2 Local Moran's I for Residential REEI shows the more efficient neighborhoods and less efficient regions are clusters together in space. It is interesting to see around the city, some clusters (“hot spots”) of more efficient neighborhoods have emerged such as the area around Porter Ranch, Granada Hills, Northridge, Chatsworth in the northwest Valley, and the southwest corner of the Valley (Woodland Hills) as well as the southeast edge of the Valley (Sherman Oaks). Also emerged more efficient neighborhoods include those at the Northeast edge of the downtown (Echo Park) and the strip along I-110 east of the University of Southern California (USC). In comparison, a few “Cool Spots” (Clusters of less efficient neighborhoods) also emerged during the period of 2009 – 2012 and they include the Northeast corner of the Valley (Sylmar) Pacoima, Arleta and Van Nuys, Canoga Park in the west side of the Valley). Other less efficient neighborhoods include the area around the Downtown. Why do we see such patterns? We hope future research will help answer such questions and answers to such questions will help LADWP to come up better programs or better approaches to reach the community.
Map 4.1 Residential Relative Energy Efficiency Index (REEI) 2009-2012
Map 4.2 Local Moran's I for Residential REEI
Map 4.3 Commercial Relative Energy Efficiency Index (REEI) 2009-2012 does not show a very clear spatial pattern: the neighborhoods with high REEI scatter around, though a number of small clusters of hot spots and cool spots do exist. The unclear spatial patterns are simply the results of the more diffused distribution of non-residential land use, which is the legacy of urban development. As such, we will not discuss such issues in detail.
Map 4.3 Commercial Relative Energy Efficiency Index (REEI) 2009-2012
Map 4.4 Local Moran's I for Commercial REEI
Dr. Yifei Sun, Department of Geography, California State University