Page Description
The following page is a three column layout with a header containing the search CSUN function. Page sections are identified with headers. The footer contains update, contact and emergency information.

USING GIS TO TARGET OUTREACH FOR LADWP CUSTOMER REBATE PROGRAMS
THIS PROJECT
This project is a collaborative effort between California State University, Northridge and the San Fernando Valley Green Team. Using geographical information systems (GIS) and spatial statistical analyses, we examine the participation in various electricity saving programs in Los Angeles Department of Water and Power and their effectiveness.
Resources:
Chapter 3 Data and Methodology
3.1 Data
3.2 Relative Energy Efficiency Index (REEI)
3.3 Moran's I
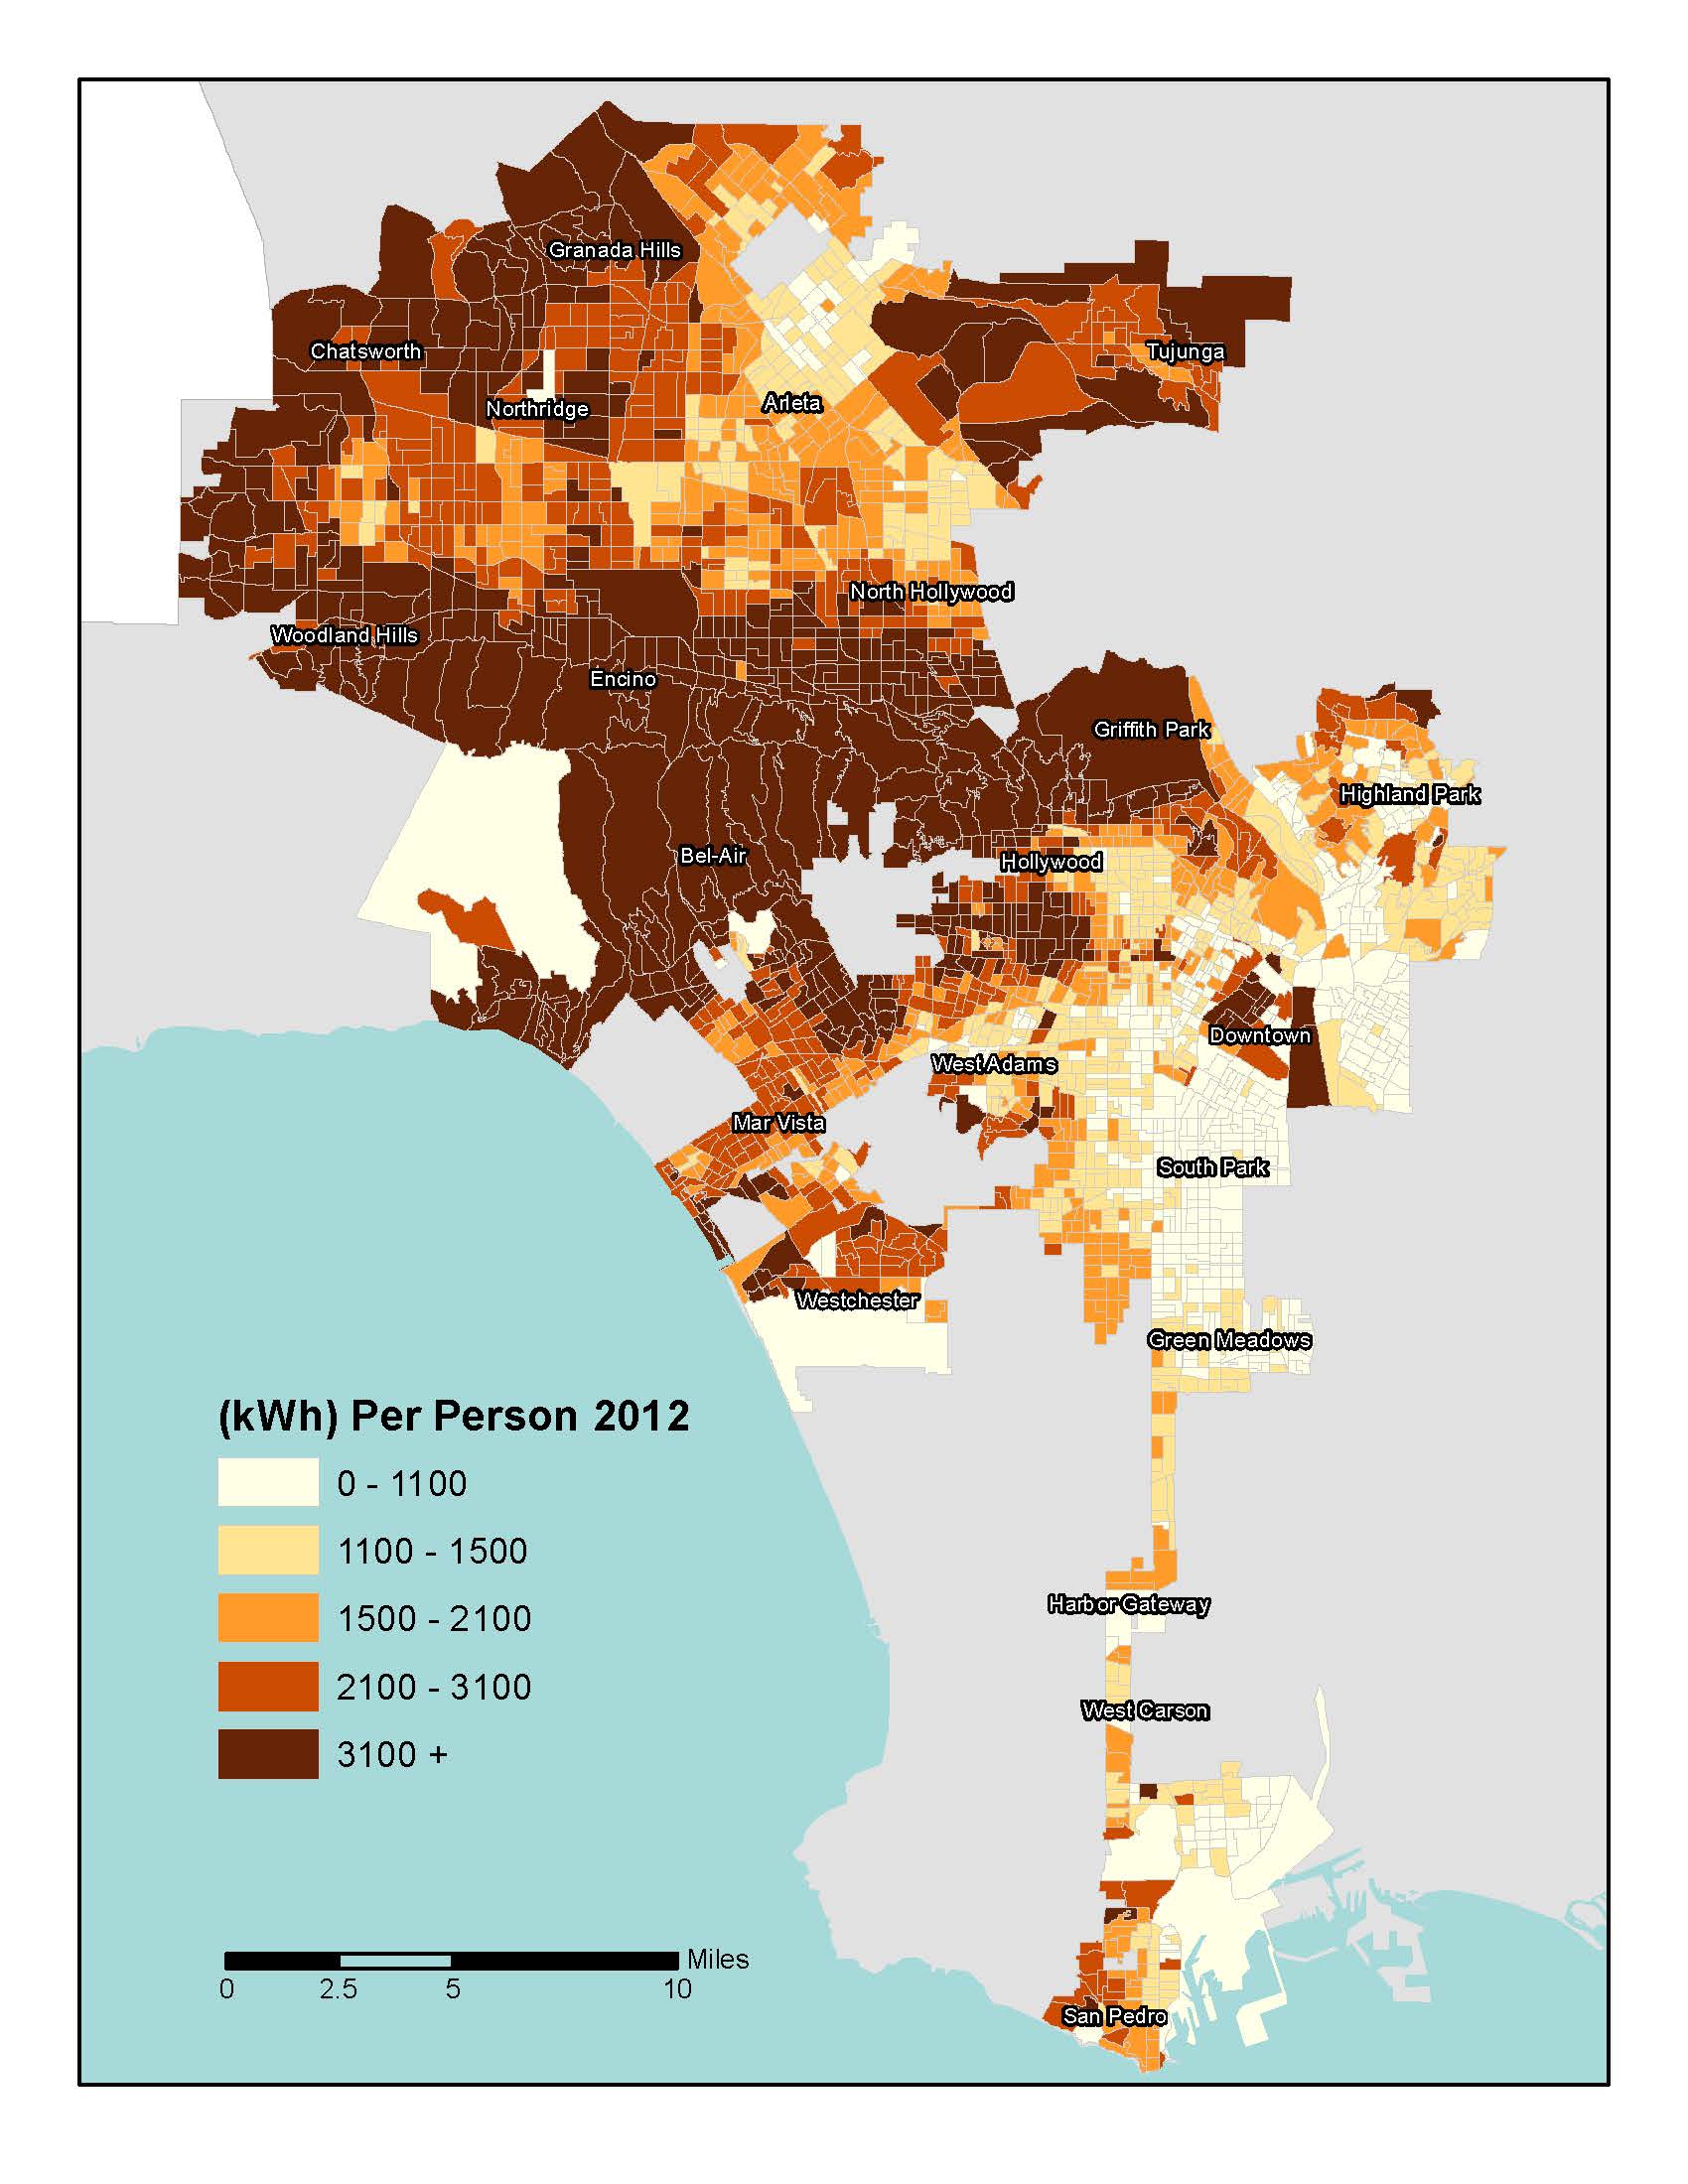
LADWP provided us one commercial and one residential KWH report that contained zip plus four data of their customer’s electricity consumption from 2009 through 2012. This data was then aggregated to the Census block group level by summarizing and joining to the block groups of the City of Los Angeles. The 2010 Census demographic data was also joined to the block group data.
Approximately 9,500 of the residential KWH report records (Zip+4), for each of the study years, were unable to be joined the city of Los Angeles census block groups shape file. This accounted for approximately 150 million kWh of electricity consumption for each year. Approximately 1,300 of the commercial KWH report records, for each of the study years, were unable to be joined as well. This accounted for approximately 800 million kWh of electricity consumption for each year. The major reason for unmatched records here is largely due to the changes in Zip+4 codes, and we only have the 2010 Zip+4 geographical boundary file. The other reason is that the original dataset from LADWP also includes a number of records at ZIP code level.
Parcel Land Use data was provided by LADWP. This data was reclassified into seven classes. Please refer to the City of Los Angeles Zoning Code for a more detailed description. Agricultural: (A1, A2), Commercial: (CR, C1, C1.5, C2, C4, C5, CM), Manufacturing: (MR1, M1, MR2, M2, M3), Other: (P, PB, OS, SL, GW(CA), WC, Various, LA flood control district, Freeway), Public: (PF, UI(CA), USC, UV(CA), UC(CA)), Residential Multiple Family: (R2, RD1.5, RD2, RD3, RD4, RD5, RD6, RMP, RW2, R3, RAS3, R4, RAS4, R5), Residential Detached or One Family: (RA, RE40, RE20, RE15, RE11, RE9, RS, R1, RU, RZ2.5, RZ3, RZ4, RW1).
Energy Efficiency Program participation data was provided by LADWP. This data set contains customer participation from 2004-2012. For commercial and residential the total participation was aggregated up until each of the following years: 2009, 2010, 2011, and 2012. This allowed for total participation in each year, and percent change in participation rate to be calculated; 2012 is the end of this study period.
Temperature zone data was provided by LADWP. The city of Los Angeles is divided into two zones: the hot zone and the cool zone. These two zones were then spatially joined to the City of Los Angeles’ census block group table and are displayed in Map 3.1.
Map 3.1 LADWP Temperature Zones
3.2 Relative Energy Efficiency Index (REEI) and Statistical Modelling
In this study, we particularly focused on the development of the Relative Energy Efficiency Index (REEI). We first calculated the electricity consumption change for each block group within the City of Los Angeles for the period from 2009 to 2012. Then we found the average consumption change for the hot and cool zones separately. Finally, we calculated the REEI by dividing the zonal average consumption growth rate by the consumption change rate for each block group. If REEI equals one, a given census block group is equally as efficient as the zonal average. If it is below one, the census block group is less efficient than the zonal average. If it is above one, it is more efficient than the zonal average.
It is important to note that outlier census block groups existed due to either large increases or decreases in electricity consumption form 2009 to 2012. We first eliminated all census block groups with greater than 100% increase in consumption. Next we eliminated all block groups with an REEI greater than two standard deviations. This procedure was applied to both the residential and commercial data.
To analyze the relationships between energy consumption and efficiency, Independent t-test for two samples was used in this analysis. The purpose of the t-test is to determine if an actual, statistical, difference exists between two groups. We expect that energy consumption and efficiency is affected by social economic factors such as household size, income, ethnicities, land use, as well as participation rates in the different LADWP programs. We classified the block groups into two groups: above or below the median value of each individual variable.
To see the more exact relationships between energy consumption and efficiency and the individual variables, we adopted the ordinary least square (OLS) linear regression. A number of assumptions were checked, including multicollinearity among the independent variables, normal distributions of the variables, among others. For the residential REEI linear regression, the customer rebate participation change variable contained outliers. After thorough examination, all block groups that contained 0% percent change and greater than 200% change were eliminated in order to meet the requirements for this statistical test.
We also used Moran’s I to analyze the spatial patterns of energy consumption and efficiency. The purpose of Moran’s I is to determine if spatial autocorrelation is taking place. The index is calculated by following the following formula.
![]()
Where wij represents the spatial adjacency matrix: 1 indicates that two spatial units (i and j) (block groups in this project) are adjacent to each other and 0 indicates that the two spatial units do not share any common boundary. zi represent the REEI for each block group. Local Moran’s I is used to see where clustering is taking place and it is calculated with the following formula
.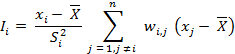
Ii is the Moran’s I for block group i; wij follows the same definition as in the above global Moran’s I definition; xi refers to the REEI for focal block group;![]() refers to global average for REEI in all blockgroups, and Si2 refers to the standard deviation of REEI in all block groups. Both the global and local Moran’s I can be tested by the T-test test for its statistical significance.
refers to global average for REEI in all blockgroups, and Si2 refers to the standard deviation of REEI in all block groups. Both the global and local Moran’s I can be tested by the T-test test for its statistical significance.
Dr. Yifei Sun, Department of Geography, California State University