General Climate Science Resources
53 Sources for Climate Change News, published by George Washington University's Milken Institute School of Public Health
Global Climate Change Education
Global Climate Change: Vital Signs of the Planet
Intergovernmental Panel on Climate Change
Mathematics of Planet Earth, 2013
National Climatic Data Center
NOAA Research
Real Climate: Climate science from climate scientists
United States Global Change Research Program
U.S. Environmental Protection Agency
Online Learning Tools
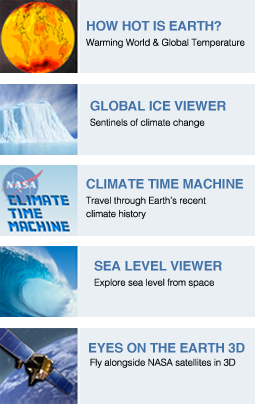
NASA Interactive quizzes
CSUN Resources
Resources for Teaching Meteorology
Weather Station
Remote Sensing Tutorials (Requires ArcGIS and/or ERDAS)
In the tutorials below, ESRI’s ArcGIS and ERDAS’s Imagine software are used to explore NASA satellite data to examine features in the earth's hydro- and bio- spheres that affect climate and indicate climate change. Several
sets of tutorials have been developed to (1) help students acquire skills in understanding, downloading and processing satellite data, (2) integrate remote sensing technology and data with GIS, (3) raise awareness about climate change.
These tutorials are geared towards post-secondary students. L3 (Level 3) exercises are directed towards undergraduates enrolled in an introductory remote sensing class. L4 (Level 4) exercises are targeted at undergraduates with some
experience in remote sensing or graduate students.
1. Mapping snow cover using MODIS
Exercise 1: The MODIS Instrument (L3, L4)
Exercise 2: Normalized Difference Snow Index (L3); Normalized Difference Snow Index (L4)
Exercise 3: Quality Control Procedures and Masks (L3); Quality Control Procedures and Masks (L4)
Exercise 4: Apply masks to create a corrected snow map (L3); Apply masks to create a corrected snow map (L4)
2. Mapping Sea Ice using a Microwave Imager/ Sounder (SSMIS)
Exercise 1: Download and import SSMIS data (L4)
Exercise 2: Calculate and Map Sea Ice Concentration (L4)
Exercise 3: Make corrections to sea ice map and compare to NASA product (L4)
3. Atmosphere
Exercise 1: Mapping Gloabl Carbon Dioxide Concentrations Using AIRS (L3)
Exercise 2: Mapping Gloabl Temperature and Ozone Using AIRS (L3)
4. Fire Mapping using ASTER
Exercise 1: The ASTER instrument and fire damage assessment (L3, L4)
Exercise 2: Calculate radiance and reflectance (L3, L4)
Exercise 3: Calculate the Normalized Burn Ratio (NBR) and difference Normalized Burn Ratio (dNBR) (L3, L4)
5. Using GRACE to evaluate change in Greenland's ice sheet
Exercise 1: Download, import and map GRACE data (L3, L4)
Exercise 2: View and animate seasonal ice sheet mass changes (L3, L4)
Exercise 3: Calculate and visualize annual ice sheet mass changes (L3, L4)
Exercise 4: Calculate annual mass loss rate (L3, L4)
6. Using Landsat to examine deforestation in Brazil
Exercise 1: Identify forested and deforested areas (L3, L4)
Exercise 2: Calculate carbon emissions from deforestation (L4)
7. Using MODIS to analyze the seasonal growing cycle of crops
Exercise 1: Understand and locate MODIS images
Exercise 2: Understand the spectral signature of vegetation
Exercise 3: Seasonal change in Normalized Difference Vegetation Index (NDVI) (L3)
Articles, Reports, and Conferences
Turn the Heat Down: Why a 4°C Wamer World Must be Avoided
A World Bank Report
The Discovery of Global Warming
by Spencer Weart, director of the Center for History of Physics at the American Institute of Physics.
KITP Program: Physics of Climate Change
(April 28 - July 11, 2008)
In partnership with the National Center for Ecological Analysis and Synthesis;
The clouds of unknowing
The Economist, March 18, 2010
Document Reader