

Economic Geography - Lab 6: Gini Coefficient and the Lorenz Curve
Locational Indices: The Gini Coeffcient and the Lorenz Curve
Under Construction
Gini Coefficient
The Gini Coefficient is a measure of inequality closely related to the measures above. It is most frequently used to measure income inequality among classes of people grouped by their wealth, but can also be used to measure other concentrations of activity by comparing "perfect" distribution against the reality of distribution.
Here's an interesting link to another step-by-step tutorial:http://www.ncat.edu/~burkeym/Gini.htm
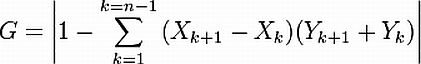 Where:
- Xk = the cumulative percentage of X at observation k
- Yk = the cumulative percentage of Y at observation k
- k+1 = the subsequent observation
Adapted from : http://people.hofstra.edu/geotrans/eng/ch4en/meth4en/ch4m1en.html
Use with some caution. I'm not convinced that they didn't fudge on their calculations a bit (switching X's and Y) in their interactive page, but nevertheless it is well done.
Here's an alternative sample of their work done in Excel
Lorenz Curve
The Lorenz Curve is a graphical representation of the preceding formulas. The accompanying Microsoft Excel file has a hypothetical application of the Lorenz Curve. Consult it to best understand how to make a Lorenz curve, or follow the directions below
- Highlight your data, including the column headings from the first column to the last column of cumlative shares.
- Click on the Chart Wizard Icon
- Pick either the two line or area option.
- From the "Series" tab, remove the series that you do not want to graph, leaving only the two cumlative series. One must be a straight linear progression.
- Change the cosmetic nature of the graph to suit your purposes.
These are your tasks:
- Under construction