Economic Geography - Measures of Central Tendency and Trade Areas
Retail Site Location
This lab will introduce you to two additional techniques that may prove useful as tools for determining the optimum retail site location for some business.
First you will be introduced to several measures of central tendency...or average location and secondarily to another tool that may help determine logical trade areas for individual businesses or operations.
Background - Measures Spatial Central Tendency
You have no doubt calculated the average for a set of numbers in grade school or junior high. You may recall calculating means, modes and medians. Geographers are also interested in calculating these figures, but geographers do so with spatial data and so the formulas look slightly different.
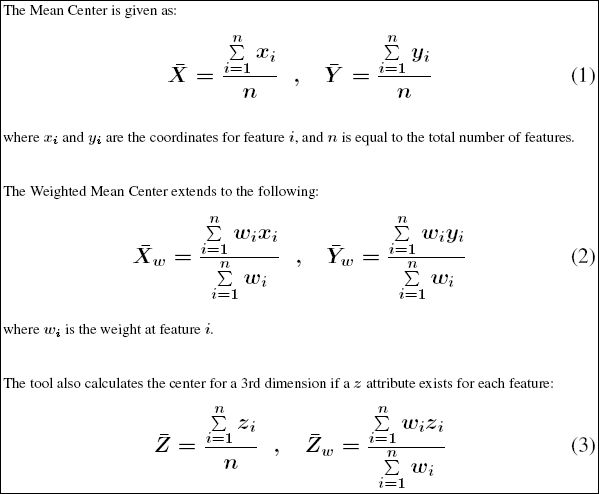
Perhaps the most basic measure of central tendency is the Mean Center. It's calculated much the same way as a numerical average, but instead you would use coordinate points.
Xc= Sum of Xi/n and Yc= Sum of Yi/n
where:
Xc = Mean of all X coordinate points (Xi's - like latitudes)
Yc= Mean of all Y coordiates points (Yi's - like longitudes)
n = number of observations (or points)
One could use this formula to find the average position among a group of points. Be warned though, the result produced by this formula can be highly affected by outliers, or points that are far away from the rest.
Frequently, geographers add "weights" to this formula, because all points may not be equal. There may be different populations or frequency of events at these points and such additional data is important. This is called a Weighted Mean Center. The formula would be transformed and would appear as:
Xwc= (Sum of Xi*w)/(Sum of w's) and Ywc= (Sum of Yi*w)/(Sum of w's)
where:
Xwc = Weighted Mean of all X coordinate points (Xi's - like latitudes)
Ywc= Weighted Mean of all Y coordiates points (Yi's - like longitudes)
W = weights (like population, customers, or freqency of events at the point)
The figure below is from the ESRI software you'll be using for this lab.
Task
You have a craving for doughnuts that won't go away. EVERY STINKING day, you wake up like some out-of-control Homer Simpson, wanting doughnuts, but you can't stand to eat doughnuts from the same shop everyday. You need to be adventurous. You would probably start on some cross-country journey of doughnut discovery, but you've got this horrible "college" thing to deal with first. Luckily, there are loads of doughnut shops in the San Fernando Valley where you attend college. Because you are a geography major, you've already mapped out the doughnut shops throughout the valley. What you need to do is to find where best to look for an apartment...a home-base from which you can prowl for doughnuts. It will have to be centrally located, because you don't want to spend too much time each day driving for doughnuts...and you're environmentally conscious!
1. Construct a map that displays doughnut shops in the San Fernando Valley and then ask the software to calculate a mean center for you.
2.
Next, use the "Ratings" column to add a weighting factor to your mean center...because you might want to be closer to the heart of yumminess.
Because you've gotten several speeding tickets fueling your doughnut habit, and several more DWD (driving while dunking) tickets in recent years... and as the court date to answer these charges is looming, you think it wise to also find out where a pedestrian doughnut junky might look to rent an apartment. You think a place that has a high density of doughnut shops would be a good location, so you search for the doughnut shop with the smallest trade area....that place that has essentially the most competing doughnut shops surrounding it. You could look for an apartment very close to that location!!!
3. Put on your map, a layer depicting the trade areas of each of the doughnut shops by using the Theissen Polygon tool. Calculate the area of each of the polygons you've created and select the polygon with the smallest area.
4. More....under construction...
Submit this lab as a .jpeg file via email.
You'll be graded mostly pass - not pass basis for this assignment.
Full credit or no credit.