
Note for the teacher
- The new California State Department of Education sets standards for the teaching of seismology in K-12 classrooms. Please review the California Science Content Standards to see how this lesson may augment your instruction.
Earthquakes and You
 On-Line Quiz: Do you
recognize any of the earthquake damage in the picture above? Take the following
quiz!
On-Line Quiz: Do you
recognize any of the earthquake damage in the picture above? Take the following
quiz!- Hypernews: List the things you should do to prepare for an earthquake: Post your thoughts on the Hypernews group.
- Mapping: Use a topographical map service to plot your home on a topographical map. Has the USGS identified any seismic hazards (landsalides, liquefaction, etc.) in your neighorhood?
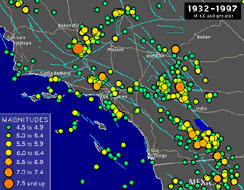
- Earthquakes in Southern California: How frequently do earthquakes occur in Southern California? Click here for animation.
- Earthquakes in California: In the last two centuries, how many California earthquakes have been of greater magnitude than the 1994 Northridge Earthquake? You may also wish to examine quakes in Southern California and quakes in other areas.
- Faults: What fault do you live closest to?
Is there any pattern to earthquake activity?
- Plot the most recent earthquakes (regardless of magnitude) using green dots on the map in your PowerPoint file.
- Compare the Richter Magnitude readings with the Mercalli Intensity measurements to determine the types of damage that could be expected accompanying the strongest earthquake this week.
- Plot the largest earthquakes in largest earthquakes in 1997 using blue dots on the map in your Word template or on a world map from or map of another region.
- Plot the most destructive earthquakes in history using red dots on the map in your Word template.
- Analyze your map and describe any pattern or patterns or earthquake occurrence.
- Is the pattern of your data consistent with compiled data of earthquake activity? Explain. You may also wish to look at recent quakes throughout the world.
- What inferences can you make from this map?
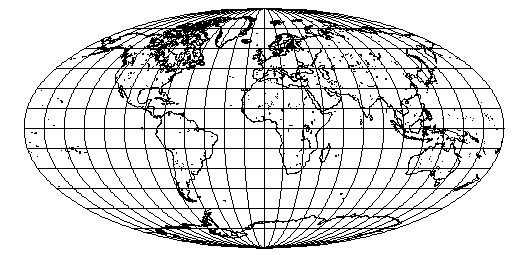
Plate Tectonics
 The theory of plate tectonics was first postulated after
analyzing the pattern of seismic data such as you have just done. Read the
following material on plate
tectonics.
The theory of plate tectonics was first postulated after
analyzing the pattern of seismic data such as you have just done. Read the
following material on plate
tectonics.- The image at the right is a satellite photo of the Sinai peninsula. Watch the space-shuttle video (Blue Planet) of this region. Locate the Sinai peninsula on the map of plate boundaries. Describe its relationship to these boundaries.
- Quiz on plate tectonics: Take the following quiz on plate tectonics. Place a screen capture of your score in the assignment template.
Analyzing Earthquake Data
- Perform the virtual eartquake lab.
- Generate a seismogram for a today and compare it with one from the day of the Northridge Earthquake, at 4:31 AM (PST) January 14, 1994.
- Is there any ground movement right now? Examine Caltech's real-time seismocam and describe what you see.
Submit your assignment
- Submit your assignment electronically as an attached document to Professor Herr.
Determining the epicenter of a quake
- Determine the epicenter using Geometer's sketchpad or similar software.