 Welcome
Below is a list of places in California, each representing a climatological region within the Golden State. Each of these links will direct you to a website that contains the information or climate data you need to make a climograph.
All of the data below was gathered from a website called worldclimate.com. At this website, you can find climate data for 85,000 places all over the world. If you are interested, you could compare climates within California, but also against places all over the world, including New York, Paris, Rome, Cairo or even Grytviken Antarctica!
Many of these locations, and the accompanying climographs can be found on a Google Earth map. Click on the link below to see the map.
California Climographs and more in Google Earth
Los Angeles - Tri County Area
| Location |
Lat. |
Long. |
Elev. |
Unit |
Jan. |
Feb. |
Mar. |
Apr. |
May |
June |
July |
Aug. |
Sept. |
Oct. |
Nov. |
Dec. |
|
Year |
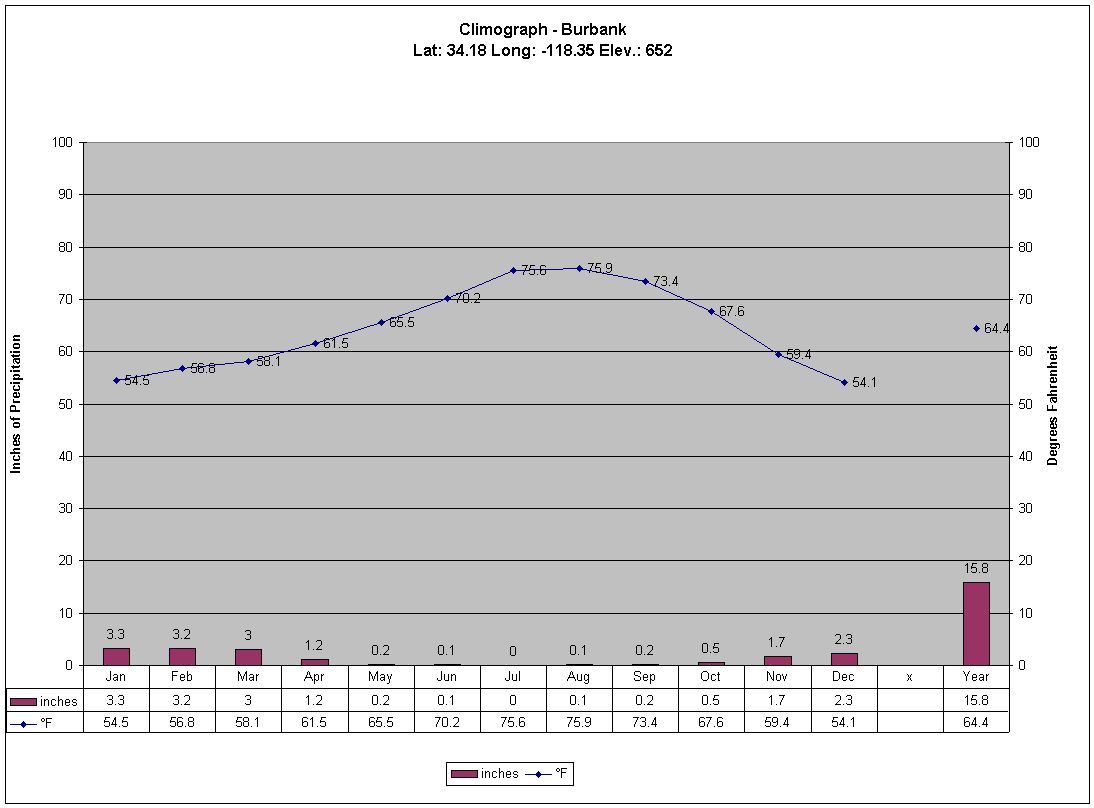
| Burbank |
34.18 |
-118.35 |
652 |
inches |
3.3 |
3.2 |
3 |
1.2 |
0.2 |
0.1 |
0 |
0.1 |
0.2 |
0.5 |
1.7 |
2.3 |
|
15.8 |
|
°F |
54.5 |
56.8 |
58.1 |
61.5 |
65.5 |
70.2 |
75.6 |
75.9 |
73.4 |
67.6 |
59.4 |
54.1 |
|
64.4 |
| Canoga Park |
34.18 |
-118.56 |
787 |
inches |
3.8 |
2.9 |
2.8 |
1.1 |
0.2 |
0 |
0 |
0.1 |
0.2 |
0.5 |
2.1 |
2.1 |
|
15.8 |
|
°F |
54 |
55.9 |
57.2 |
60.8 |
65.1 |
70.5 |
76.3 |
76.6 |
73 |
67.1 |
58.8 |
53.8 |
|
64 |
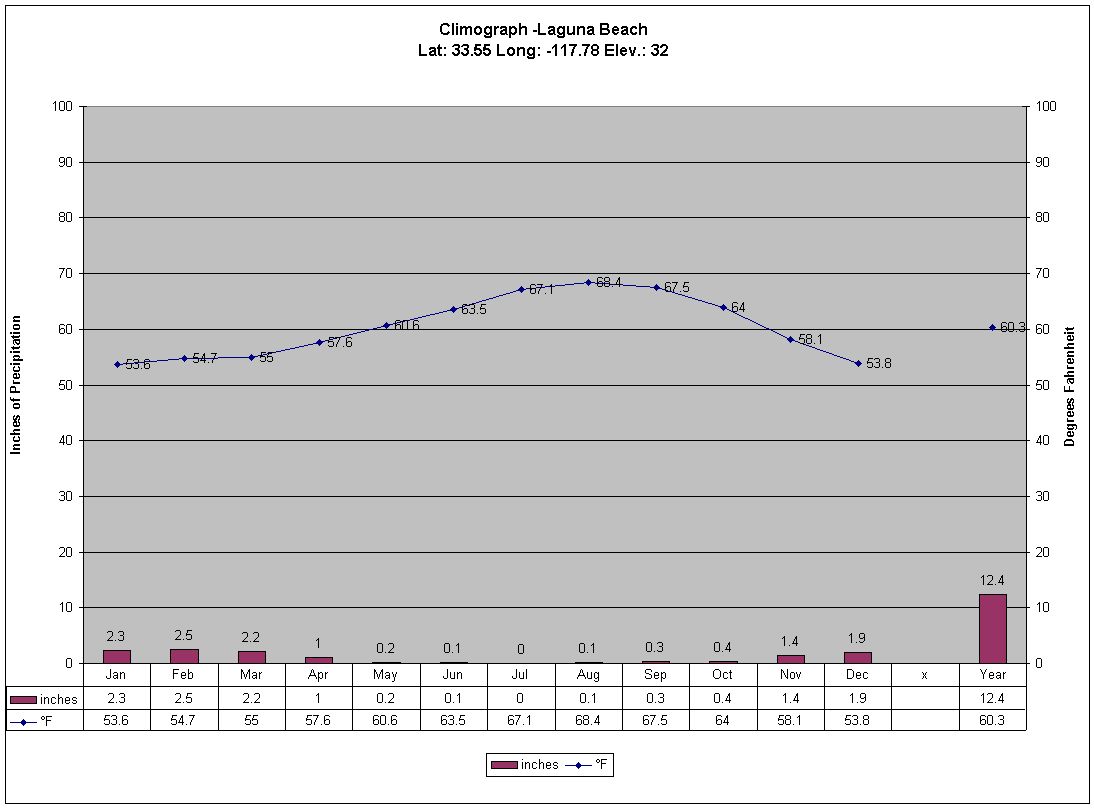
| Laguna Beach |
33.55 |
-117.78 |
32 |
inches |
2.3 |
2.5 |
2.2 |
1 |
0.2 |
0.1 |
0 |
0.1 |
0.3 |
0.4 |
1.4 |
1.9 |
|
12.4 |
|
°F |
53.6 |
54.7 |
55 |
57.6 |
60.6 |
63.5 |
67.1 |
68.4 |
67.5 |
64 |
58.1 |
53.8 |
|
60.3 |
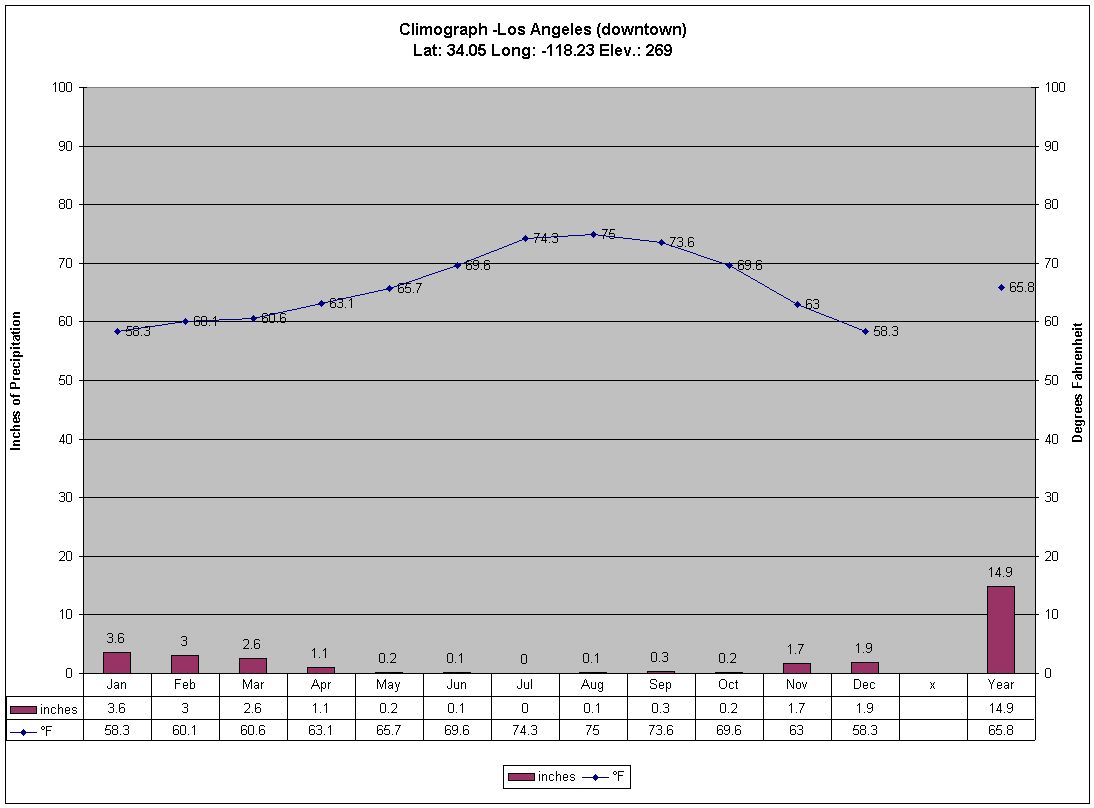
| Los Angeles (downtown) |
34.05 |
-118.23 |
269 |
inches |
3.6 |
3 |
2.6 |
1.1 |
0.2 |
0.1 |
0 |
0.1 |
0.3 |
0.2 |
1.7 |
1.9 |
|
14.9 |
|
°F |
58.3 |
60.1 |
60.6 |
63.1 |
65.7 |
69.6 |
74.3 |
75 |
73.6 |
69.6 |
63 |
58.3 |
|
65.8 |
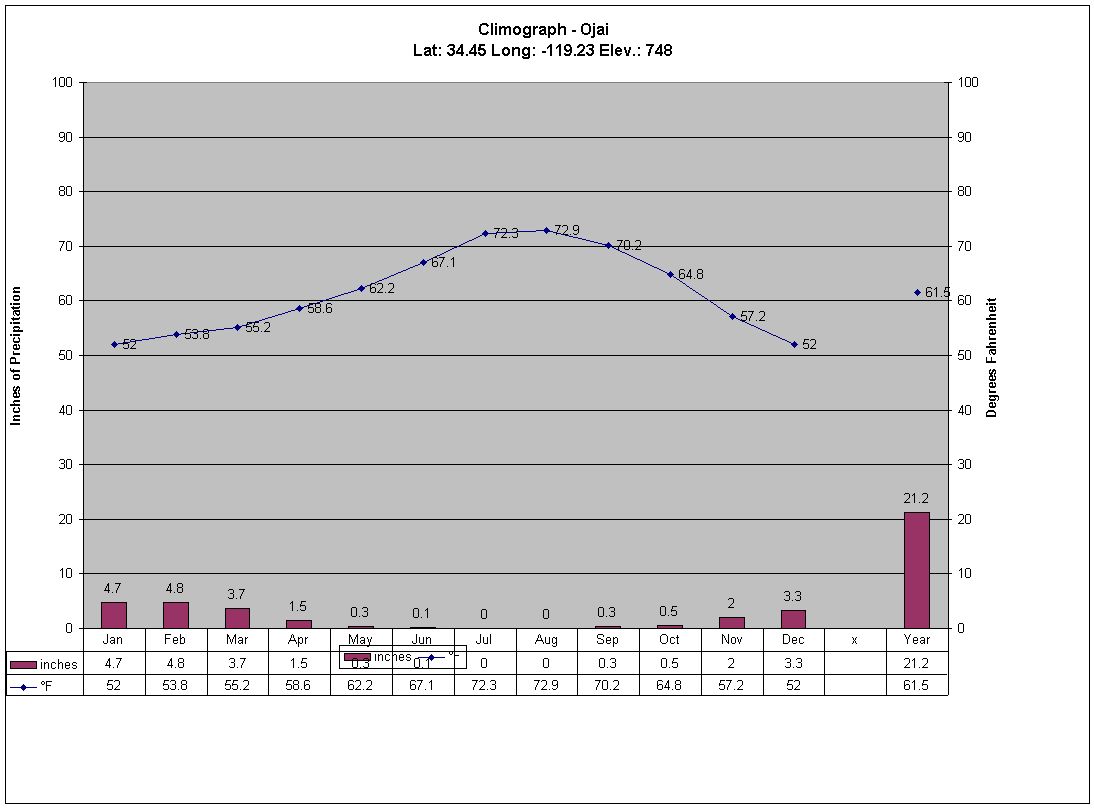
| Ojai |
34.45 |
-119.23 |
748 |
inches |
4.7 |
4.8 |
3.7 |
1.5 |
0.3 |
0.1 |
0 |
0 |
0.3 |
0.5 |
2 |
3.3 |
|
21.2 |
|
°F |
52 |
53.8 |
55.2 |
58.6 |
62.2 |
67.1 |
72.3 |
72.9 |
70.2 |
64.8 |
57.2 |
52 |
|
61.5 |
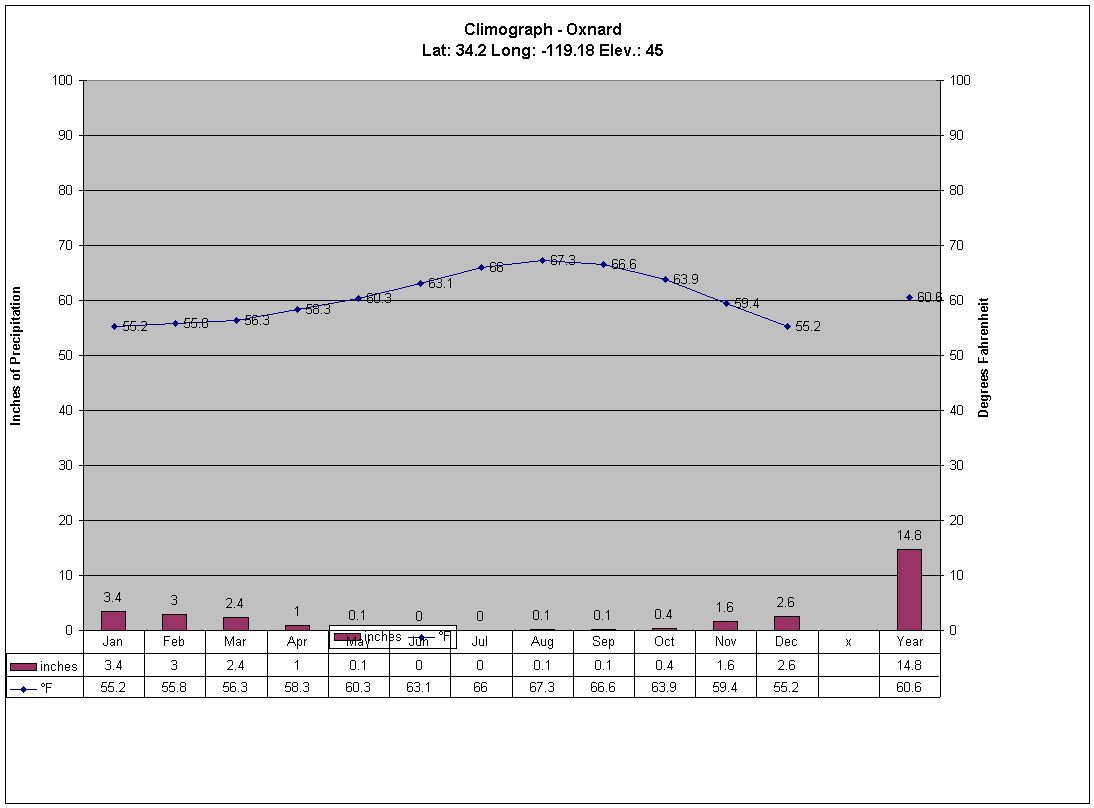
| Oxnard |
34.2 |
-119.18 |
45 |
inches |
3.4 |
3 |
2.4 |
1 |
0.1 |
0 |
0 |
0.1 |
0.1 |
0.4 |
1.6 |
2.6 |
|
14.8 |
|
°F |
55.2 |
55.8 |
56.3 |
58.3 |
60.3 |
63.1 |
66 |
67.3 |
66.6 |
63.9 |
59.4 |
55.2 |
|
60.6 |
| Palmdale |
34.58 |
-118.1 |
2595 |
inches |
1.6 |
1.6 |
1.4 |
0.5 |
0.1 |
0 |
0 |
0.2 |
0.2 |
0.3 |
0.7 |
1.4 |
|
8.1 |
|
°F |
45 |
49.1 |
52.3 |
57.9 |
65.7 |
73.9 |
80.6 |
79.7 |
73.2 |
63.7 |
52.2 |
44.6 |
|
61.5 |
| Pasadena |
34.15 |
-118.15 |
862 |
inches |
3.8 |
3.9 |
3.5 |
1.4 |
0.3 |
0.1 |
0 |
0.2 |
0.5 |
0.5 |
2.6 |
2.4 |
|
19.4 |
|
°F |
53.8 |
55.6 |
57.2 |
60.6 |
63.7 |
68.2 |
73.6 |
74.1 |
72.1 |
66.6 |
60.1 |
54.9 |
|
63.3 |
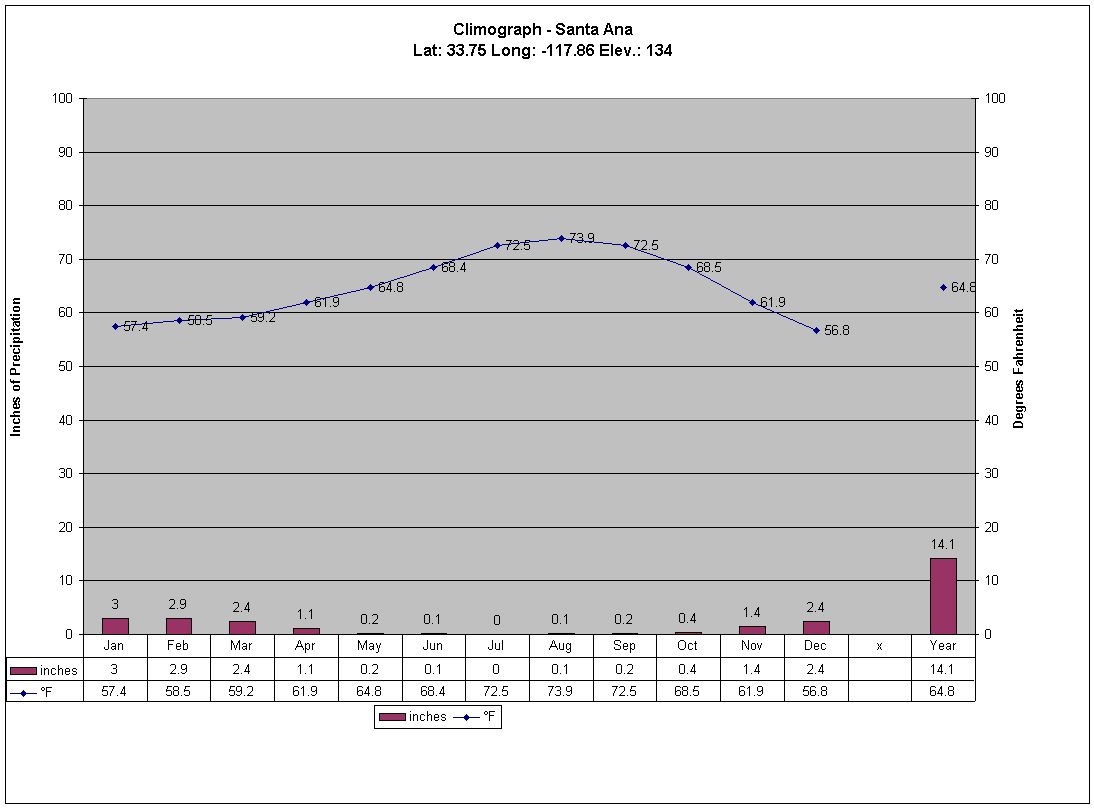
| Santa Ana |
33.75 |
-117.86 |
134 |
inches |
3 |
2.9 |
2.4 |
1.1 |
0.2 |
0.1 |
0 |
0.1 |
0.2 |
0.4 |
1.4 |
2.4 |
|
14.1 |
|
°F |
57.4 |
58.5 |
59.2 |
61.9 |
64.8 |
68.4 |
72.5 |
73.9 |
72.5 |
68.5 |
61.9 |
56.8 |
|
64.8 |
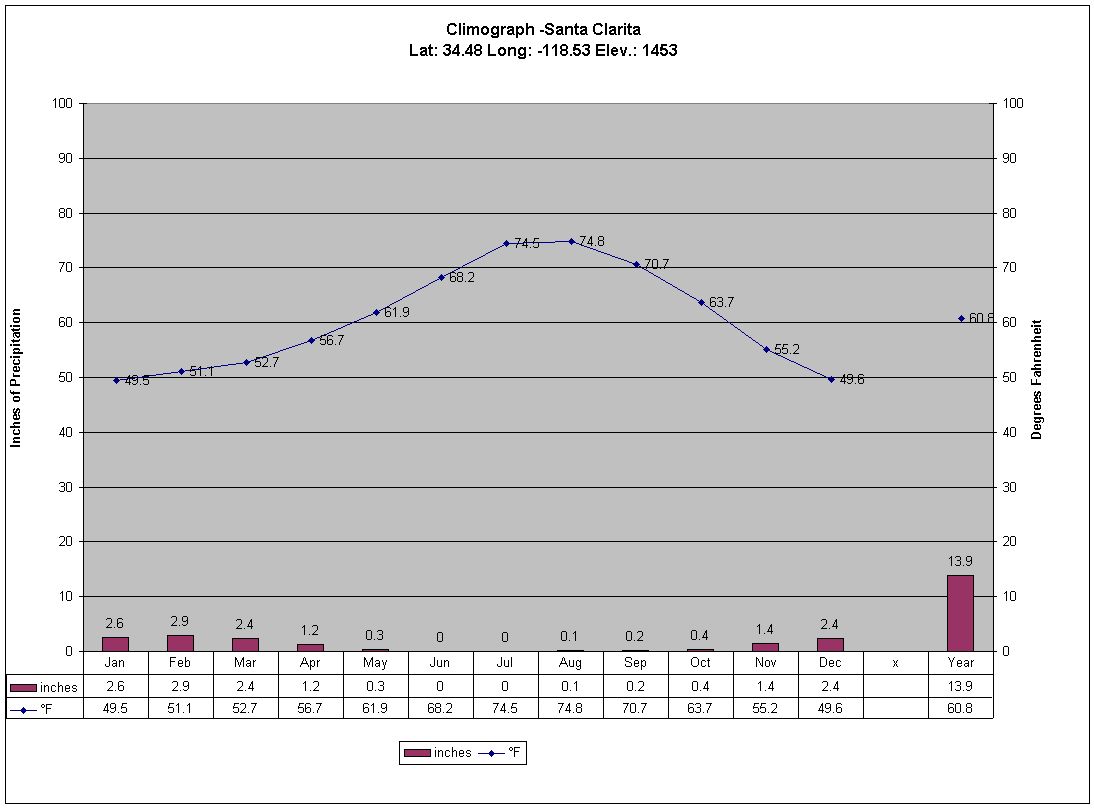
| Santa Clarita |
34.48 |
-118.53 |
1453 |
inches |
2.6 |
2.9 |
2.4 |
1.2 |
0.3 |
0 |
0 |
0.1 |
0.2 |
0.4 |
1.4 |
2.4 |
|
13.9 |
|
°F |
49.5 |
51.1 |
52.7 |
56.7 |
61.9 |
68.2 |
74.5 |
74.8 |
70.7 |
63.7 |
55.2 |
49.6 |
|
60.8 |
| Santa Monica Pier |
34 |
-118.5 |
13 |
inches |
2.6 |
2.8 |
2.2 |
0.8 |
0.1 |
0 |
0 |
0.1 |
0.1 |
0.2 |
1.6 |
2.2 |
|
12.8 |
|
°F |
57.2 |
57.4 |
56.8 |
58.1 |
59.7 |
62.2 |
65.5 |
67.1 |
66.7 |
64.8 |
61.2 |
57.6 |
|
61.2 |
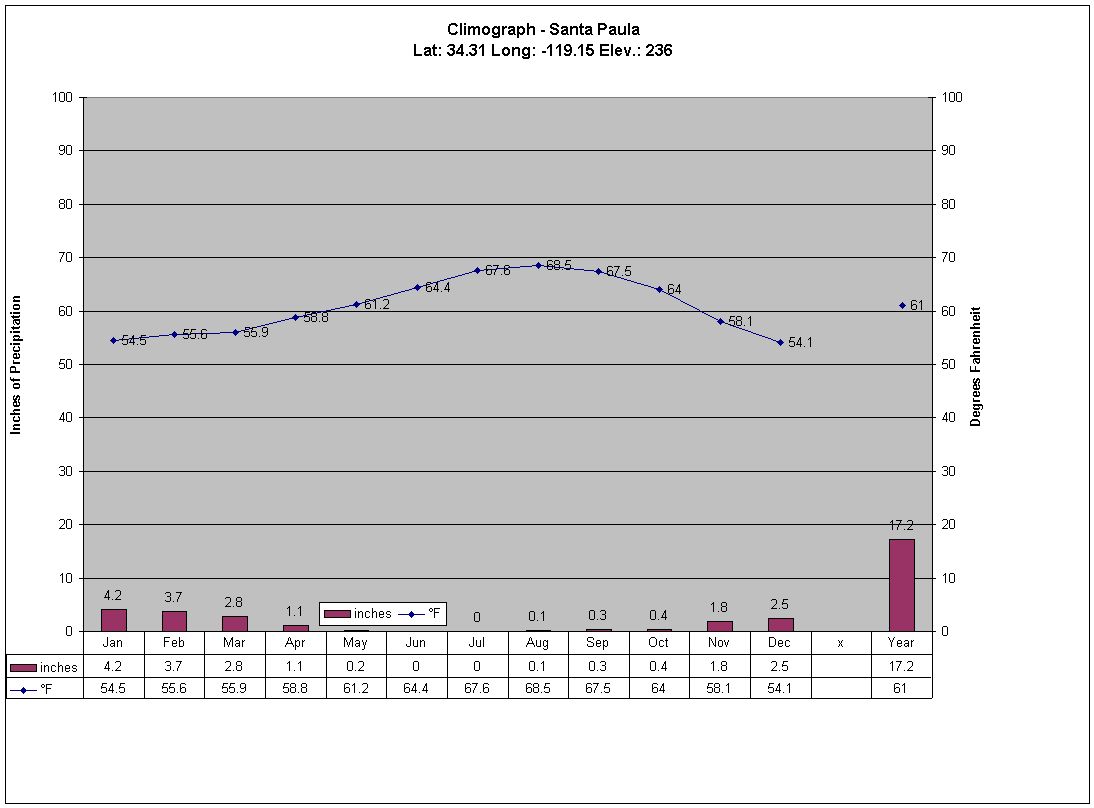
| Santa Paula |
34.31 |
-119.15 |
236 |
inches |
4.2 |
3.7 |
2.8 |
1.1 |
0.2 |
0 |
0 |
0.1 |
0.3 |
0.4 |
1.8 |
2.5 |
|
17.2 |
|
°F |
54.5 |
55.6 |
55.9 |
58.8 |
61.2 |
64.4 |
67.6 |
68.5 |
67.5 |
64 |
58.1 |
54.1 |
|
61 |
Rest of California
| Location |
Lat. |
Long. |
Elev. |
Unit |
Jan. |
Feb. |
Mar. |
Apr. |
May |
June |
July |
Aug. |
Sept. |
Oct. |
Nov. |
Dec. |
|
Year |
| 29 Palms |
34.13 |
-116.03 |
1975 |
inches |
0.5 |
0.3 |
0.4 |
0.1 |
0.1 |
0 |
0.6 |
0.7 |
0.4 |
0.3 |
0.3 |
0.5 |
|
4.3 |
|
°F |
49.3 |
53.6 |
58.1 |
64.9 |
73.6 |
82.4 |
88.2 |
86.4 |
79.5 |
68.9 |
56.5 |
48.9 |
|
67.5 |
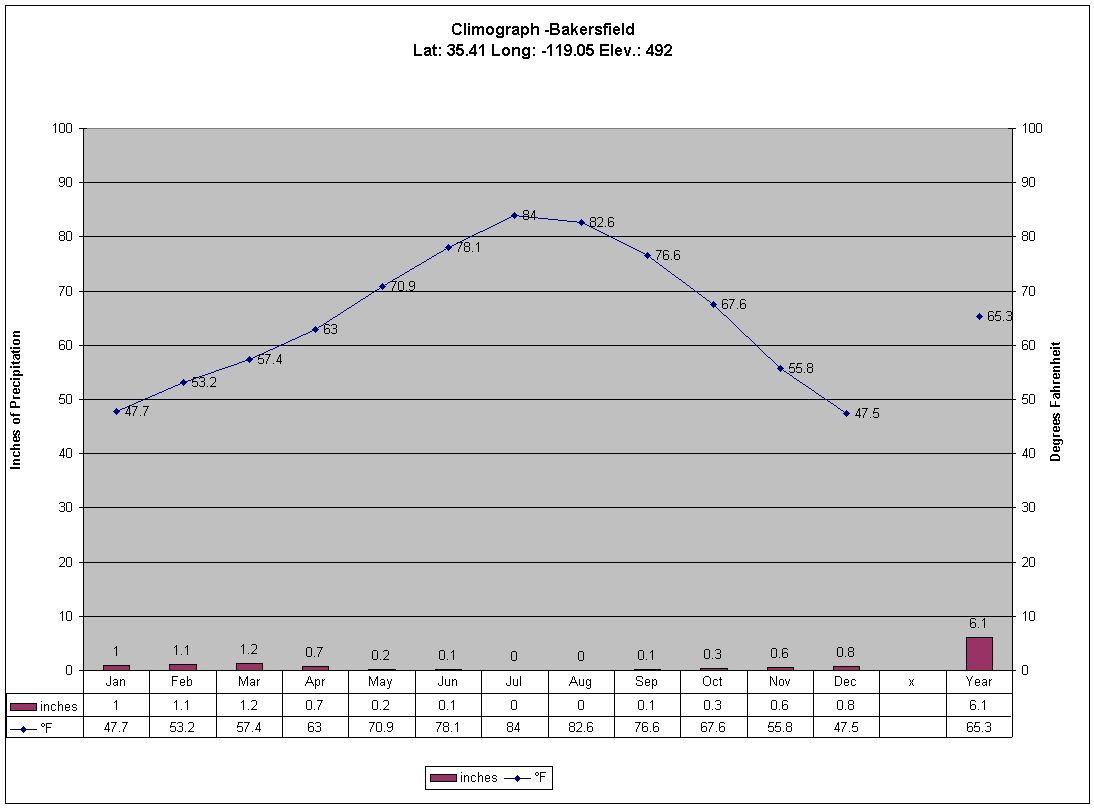
| Bakersfield |
35.41 |
-119.05 |
492 |
inches |
1 |
1.1 |
1.2 |
0.7 |
0.2 |
0.1 |
0 |
0 |
0.1 |
0.3 |
0.6 |
0.8 |
|
6.1 |
|
°F |
47.7 |
53.2 |
57.4 |
63 |
70.9 |
78.1 |
84 |
82.6 |
76.6 |
67.6 |
55.8 |
47.5 |
|
65.3 |
| Big Bear |
34.25 |
-116.88 |
6788 |
inches |
4.9 |
4.1 |
3.6 |
1.6 |
0.4 |
0.2 |
0.6 |
0.9 |
0.6 |
0.7 |
2.4 |
3.6 |
|
23.7 |
|
°F |
33.1 |
34.7 |
36.7 |
42.1 |
49.5 |
57.7 |
63.5 |
62.2 |
56.5 |
48.2 |
39.6 |
34 |
|
46.6 |
| Bishop |
37.36 |
-118.36 |
4107 |
inches |
1 |
1 |
0.5 |
0.3 |
0.3 |
0.1 |
0.2 |
0.1 |
0.2 |
0.2 |
0.6 |
0.9 |
|
5.4 |
|
°F |
37.8 |
42.3 |
46.8 |
53.2 |
62.1 |
70.9 |
76.6 |
74.5 |
66.7 |
56.8 |
45.1 |
37.8 |
|
55.9 |
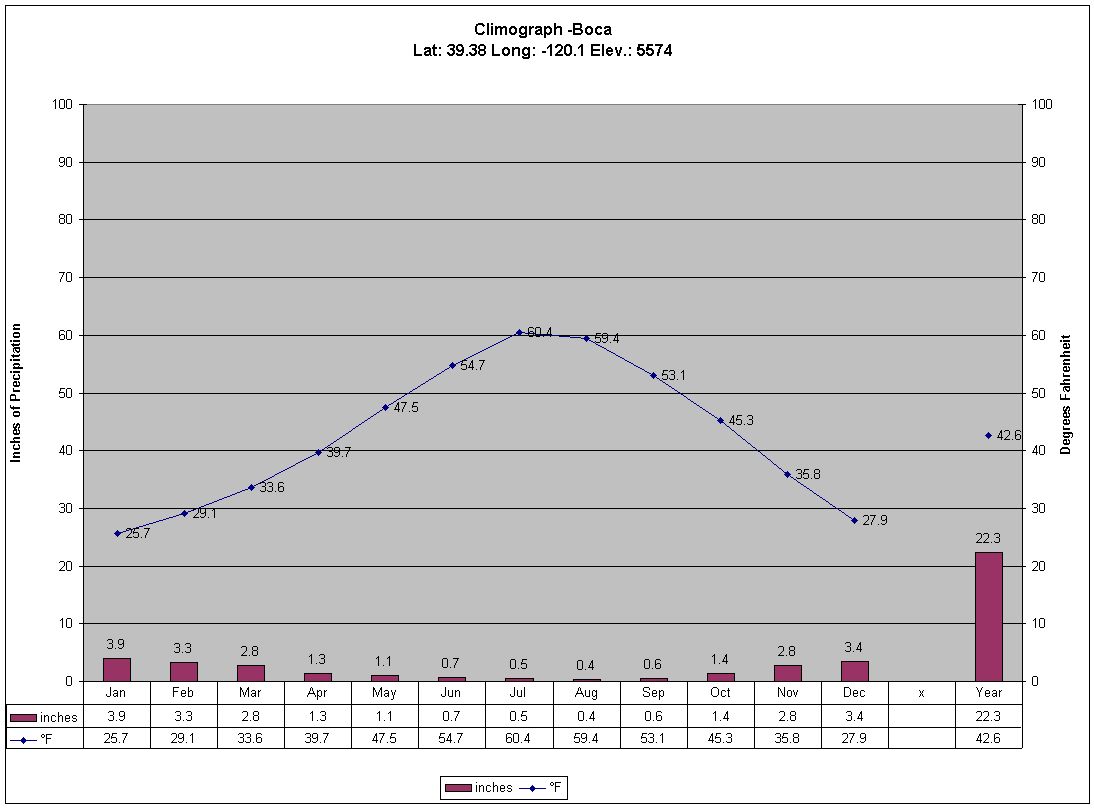
| Boca |
39.38 |
-120.1 |
5574 |
inches |
3.9 |
3.3 |
2.8 |
1.3 |
1.1 |
0.7 |
0.5 |
0.4 |
0.6 |
1.4 |
2.8 |
3.4 |
|
22.3 |
|
°F |
25.7 |
29.1 |
33.6 |
39.7 |
47.5 |
54.7 |
60.4 |
59.4 |
53.1 |
45.3 |
35.8 |
27.9 |
|
42.6 |
| Death Valley |
36.5 |
-116.9 |
-193 |
inches |
0.3 |
0.5 |
0.3 |
0.1 |
0.1 |
0 |
0.1 |
0.1 |
0.2 |
0.1 |
0.2 |
0.2 |
|
2.4 |
|
°F |
51.6 |
59.2 |
66.6 |
74.8 |
84.7 |
94.5 |
100.8 |
98.8 |
90 |
76.6 |
61.9 |
50.7 |
|
75.7 |
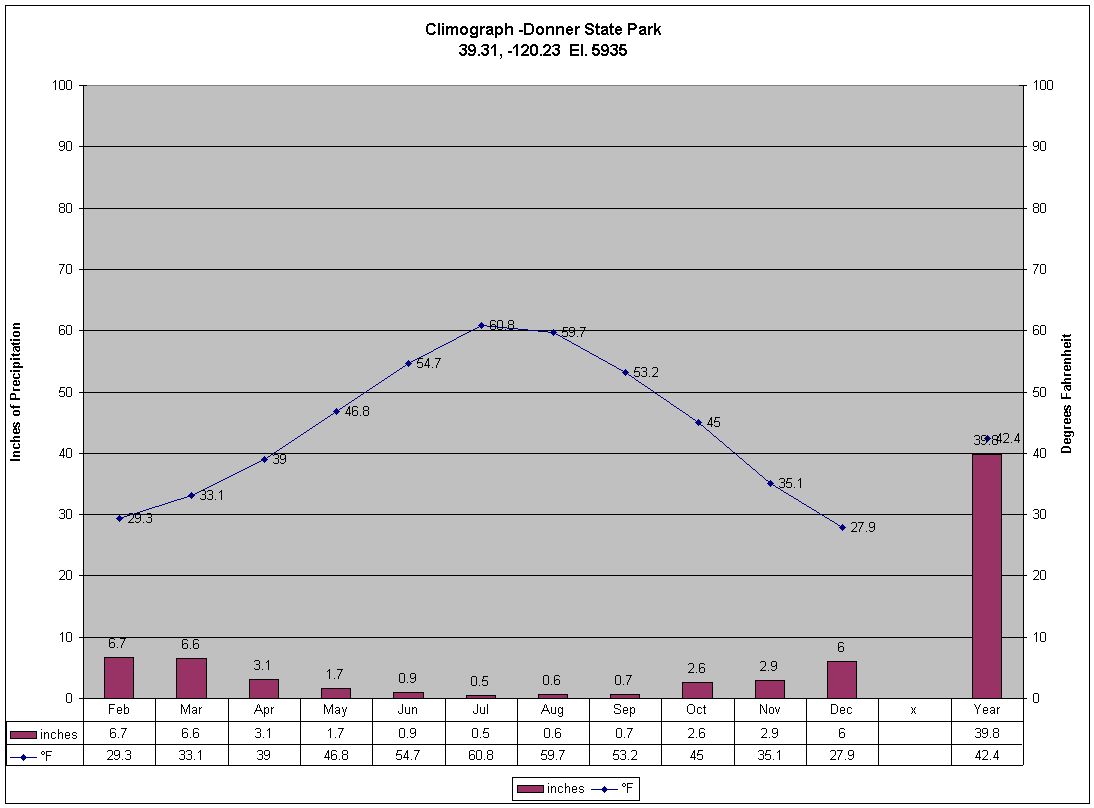
| Donner St. Park |
39.31 |
-120.23 |
5935 |
inches |
7.5 |
6.7 |
6.6 |
3.1 |
1.7 |
0.9 |
0.5 |
0.6 |
0.7 |
2.6 |
2.9 |
6 |
|
39.8 |
|
°F |
26.6 |
29.3 |
33.1 |
39 |
46.8 |
54.7 |
60.8 |
59.7 |
53.2 |
45 |
35.1 |
27.9 |
|
42.4 |
| Eureka |
40.79 |
-124.1 |
42 |
inches |
6.6 |
5.7 |
5.2 |
3 |
1.8 |
0.7 |
0.1 |
0.2 |
0.9 |
2.6 |
5.3 |
6.3 |
|
38.5 |
|
°F |
47.3 |
48.2 |
48.7 |
50 |
52.5 |
55 |
56.1 |
56.8 |
56.3 |
54.1 |
51.3 |
48.2 |
|
52 |
| Fresno |
36.78 |
-119.71 |
334 |
inches |
2 |
1.8 |
1.9 |
1 |
0.3 |
0.1 |
0 |
0 |
0.1 |
0.5 |
1.1 |
1.6 |
|
10.6 |
|
°F |
45.7 |
51.1 |
55 |
61.2 |
68.9 |
76.5 |
81.9 |
80.2 |
74.5 |
65.1 |
53.6 |
45.3 |
|
63.1 |
| Imperial Valley |
32.85 |
-115.56 |
-62 |
inches |
0.4 |
0.4 |
0.3 |
0.1 |
0 |
0 |
0.1 |
0.3 |
0.3 |
0.3 |
0.2 |
0.5 |
|
2.9 |
|
°F |
55.6 |
60.1 |
64 |
70.2 |
77.4 |
86 |
91.8 |
91 |
85.3 |
75 |
63.7 |
55.6 |
|
72.9 |
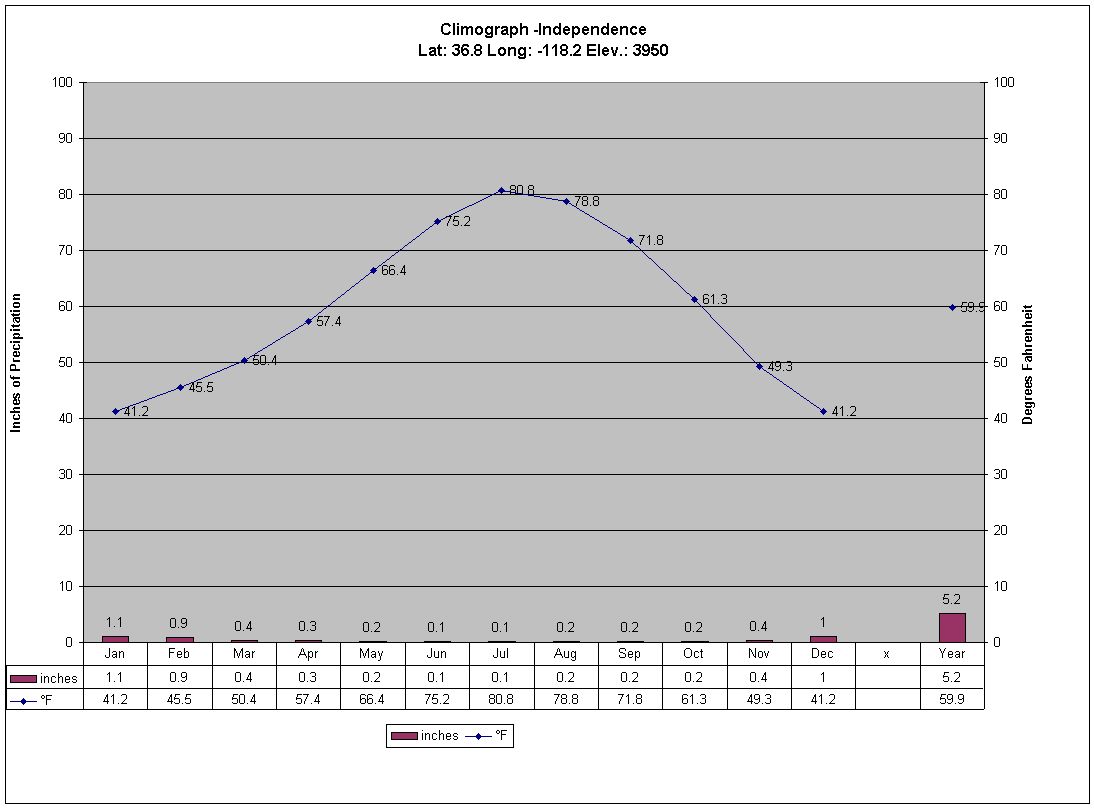
| Independence |
36.8 |
-118.2 |
3950 |
inches |
1.1 |
0.9 |
0.4 |
0.3 |
0.2 |
0.1 |
0.1 |
0.2 |
0.2 |
0.2 |
0.4 |
1 |
|
5.2 |
|
°F |
41.2 |
45.5 |
50.4 |
57.4 |
66.4 |
75.2 |
80.8 |
78.8 |
71.8 |
61.3 |
49.3 |
41.2 |
|
59.9 |
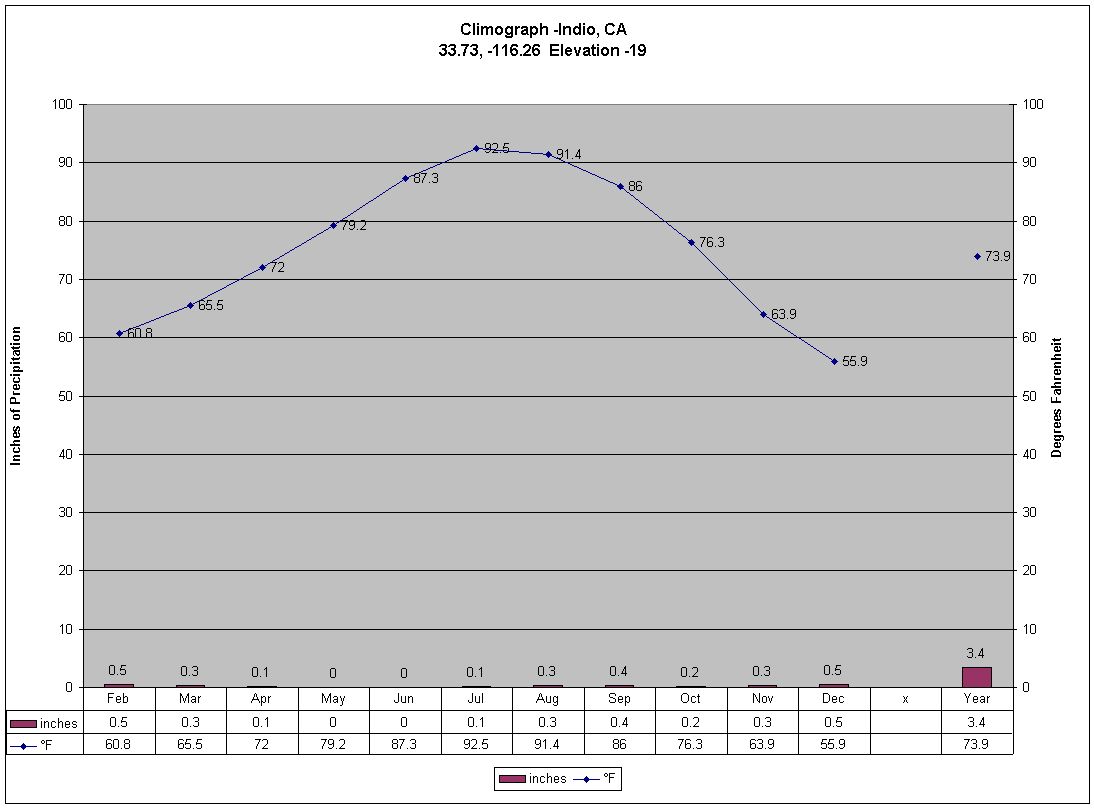
| Indio |
33.73 |
-116.26 |
-19 |
inches |
0.6 |
0.5 |
0.3 |
0.1 |
0 |
0 |
0.1 |
0.3 |
0.4 |
0.2 |
0.3 |
0.5 |
|
3.4 |
|
°F |
55.8 |
60.8 |
65.5 |
72 |
79.2 |
87.3 |
92.5 |
91.4 |
86 |
76.3 |
63.9 |
55.9 |
|
73.9 |
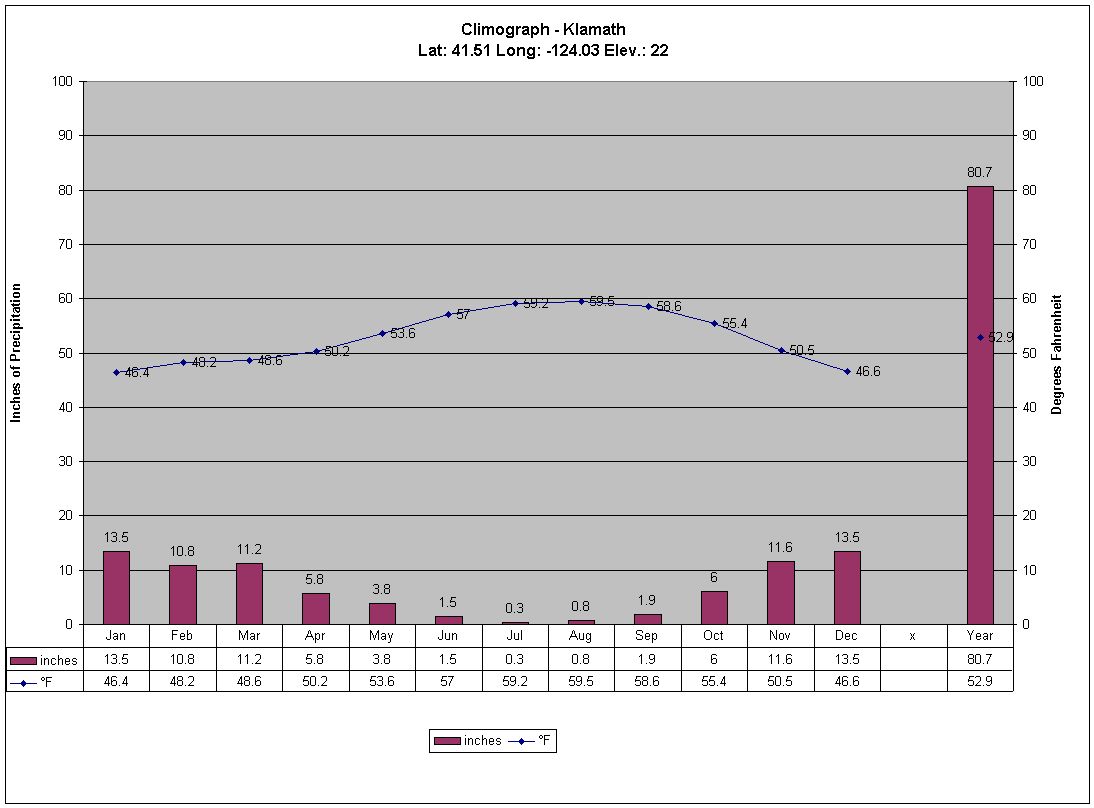
| Klamath |
41.51 |
-124.03 |
22 |
inches |
13.5 |
10.8 |
11.2 |
5.8 |
3.8 |
1.5 |
0.3 |
0.8 |
1.9 |
6 |
11.6 |
13.5 |
|
80.7 |
|
°F |
46.4 |
48.2 |
48.6 |
50.2 |
53.6 |
57 |
59.2 |
59.5 |
58.6 |
55.4 |
50.5 |
46.6 |
|
52.9 |
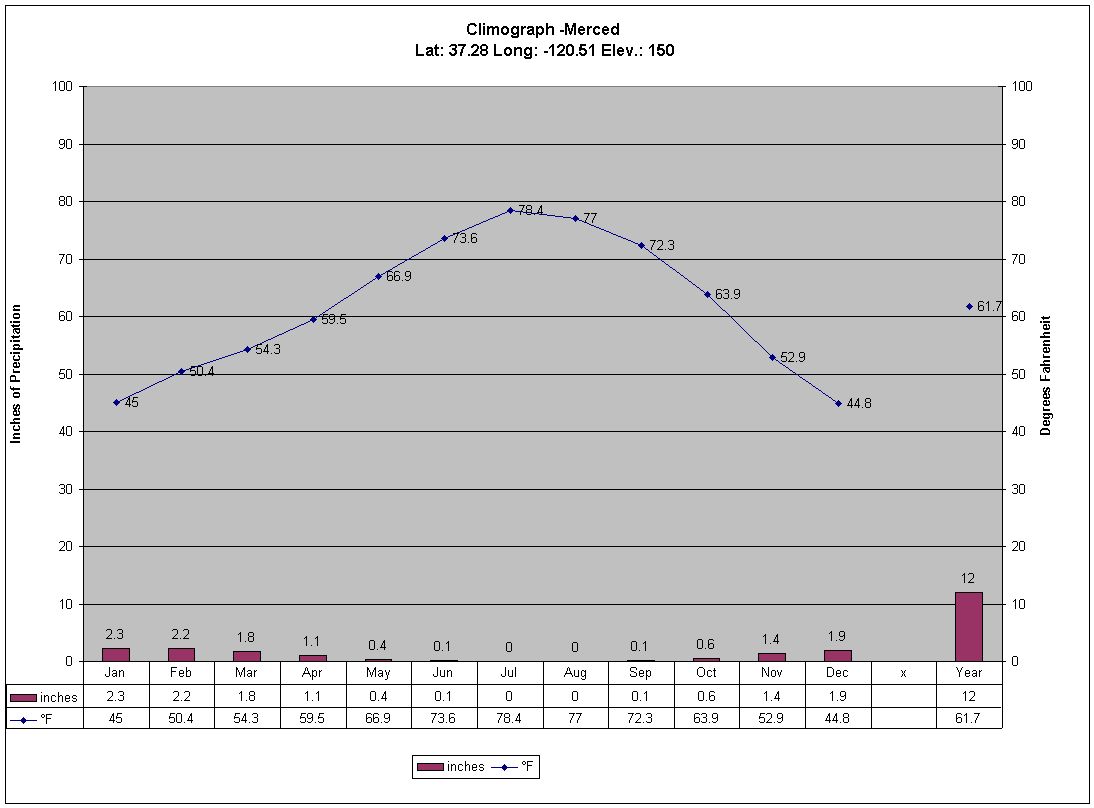
| Merced |
37.28 |
-120.51 |
150 |
inches |
2.3 |
2.2 |
1.8 |
1.1 |
0.4 |
0.1 |
0 |
0 |
0.1 |
0.6 |
1.4 |
1.9 |
|
12 |
|
°F |
45 |
50.4 |
54.3 |
59.5 |
66.9 |
73.6 |
78.4 |
77 |
72.3 |
63.9 |
52.9 |
44.8 |
|
61.7 |
| Palm Springs |
33.83 |
-116.5 |
423 |
inches |
1.1 |
1.2 |
0.6 |
0.2 |
0.1 |
0 |
0.2 |
0.3 |
0.3 |
0.3 |
0.4 |
0.9 |
|
5.7 |
|
°F |
56.3 |
60.8 |
64.2 |
70.3 |
77.7 |
85.6 |
91.9 |
90.9 |
84.7 |
75.4 |
63.7 |
55.9 |
|
73 |
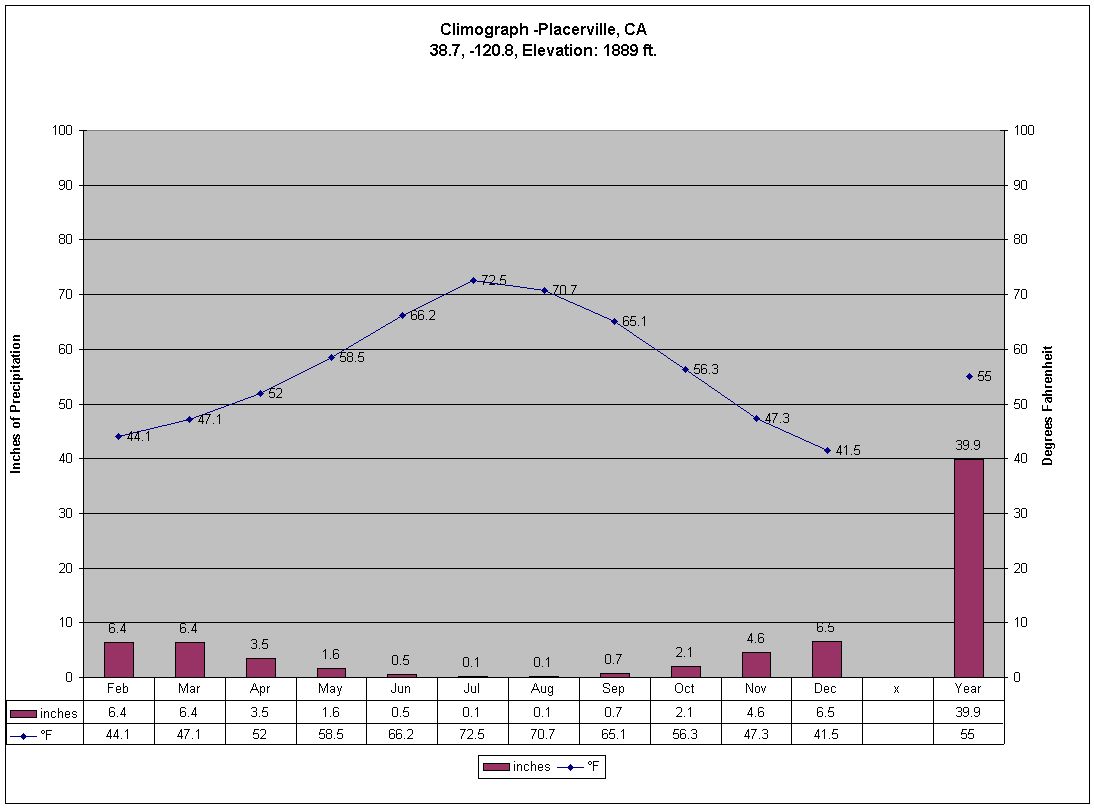
| Placerville |
38.7 |
-120.8 |
1889 |
inches |
7.6 |
6.4 |
6.4 |
3.5 |
1.6 |
0.5 |
0.1 |
0.1 |
0.7 |
2.1 |
4.6 |
6.5 |
|
39.9 |
|
°F |
40.8 |
44.1 |
47.1 |
52 |
58.5 |
66.2 |
72.5 |
70.7 |
65.1 |
56.3 |
47.3 |
41.5 |
|
55 |
| Redding |
40.5 |
-122.3 |
501 |
inches |
7.2 |
4.1 |
6.3 |
2.2 |
2.5 |
0.9 |
0.1 |
0.3 |
0.7 |
1.8 |
2.7 |
5.3 |
|
34.2 |
|
°F |
45.5 |
50.5 |
52.2 |
57.9 |
66.4 |
76.1 |
81.5 |
79.3 |
73.9 |
63.5 |
51.8 |
45 |
|
61.9 |
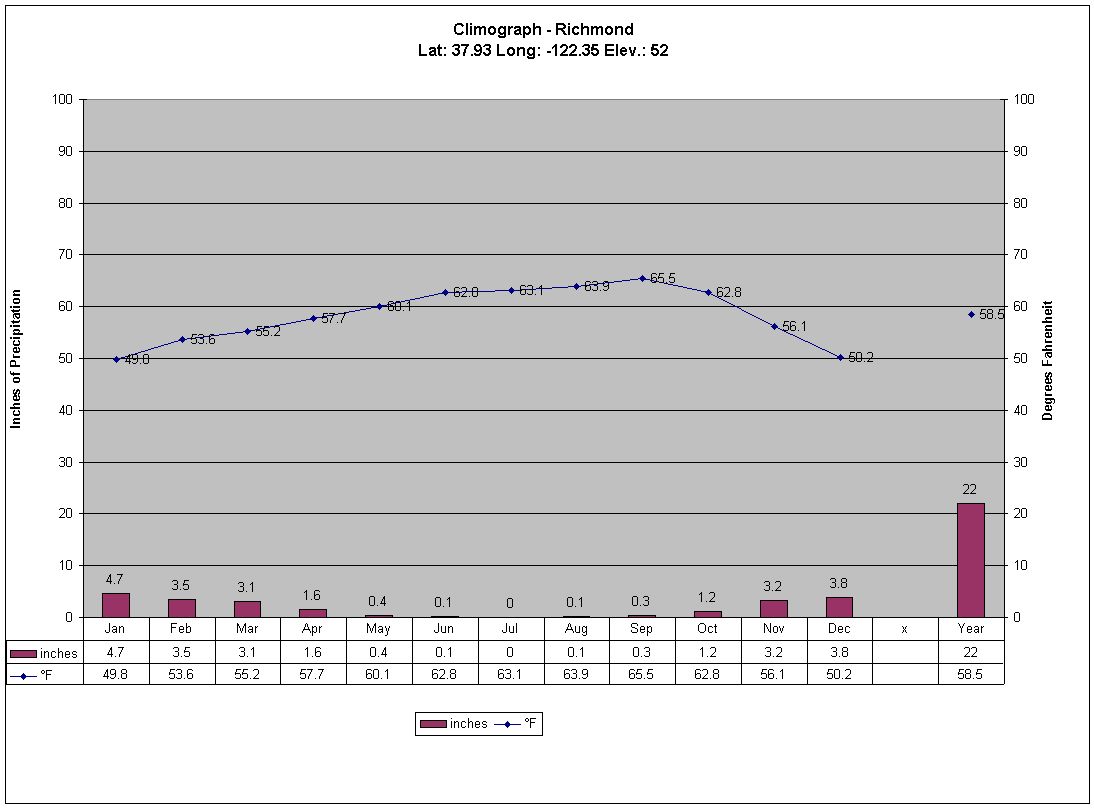
| Richmond |
37.93 |
-122.35 |
52 |
inches |
4.7 |
3.5 |
3.1 |
1.6 |
0.4 |
0.1 |
0 |
0.1 |
0.3 |
1.2 |
3.2 |
3.8 |
|
22 |
|
°F |
49.8 |
53.6 |
55.2 |
57.7 |
60.1 |
62.8 |
63.1 |
63.9 |
65.5 |
62.8 |
56.1 |
50.2 |
|
58.5 |
| Sacramento |
38.52 |
-121.5 |
26 |
inches |
3.6 |
3 |
2.6 |
1.4 |
0.6 |
0.1 |
0 |
0 |
0.3 |
0.8 |
2 |
3.3 |
|
17.7 |
|
°F |
45.5 |
50.4 |
54 |
58.6 |
64.2 |
70.5 |
74.5 |
73.8 |
70.5 |
63.3 |
53.4 |
46 |
|
60.4 |
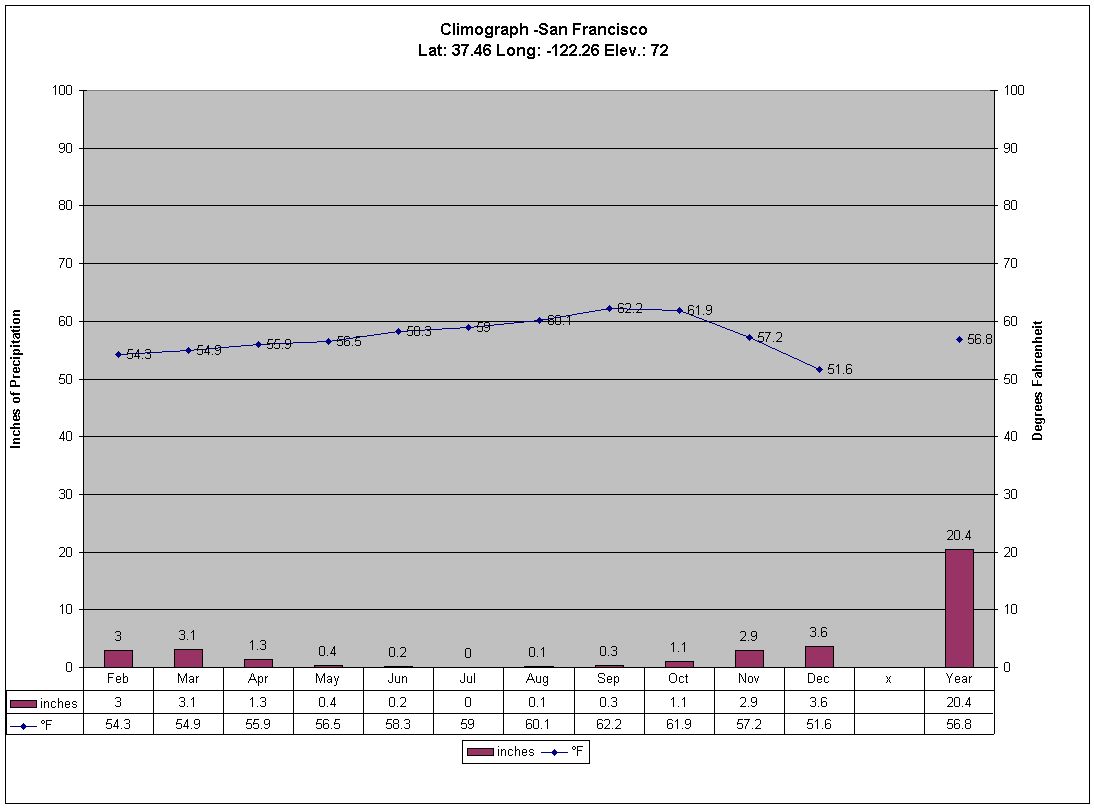
| San Francisco |
37.46 |
-122.26 |
72 |
inches |
4.4 |
3 |
3.1 |
1.3 |
0.4 |
0.2 |
0 |
0.1 |
0.3 |
1.1 |
2.9 |
3.6 |
|
20.4 |
|
°F |
51.1 |
54.3 |
54.9 |
55.9 |
56.5 |
58.3 |
59 |
60.1 |
62.2 |
61.9 |
57.2 |
51.6 |
|
56.8 |
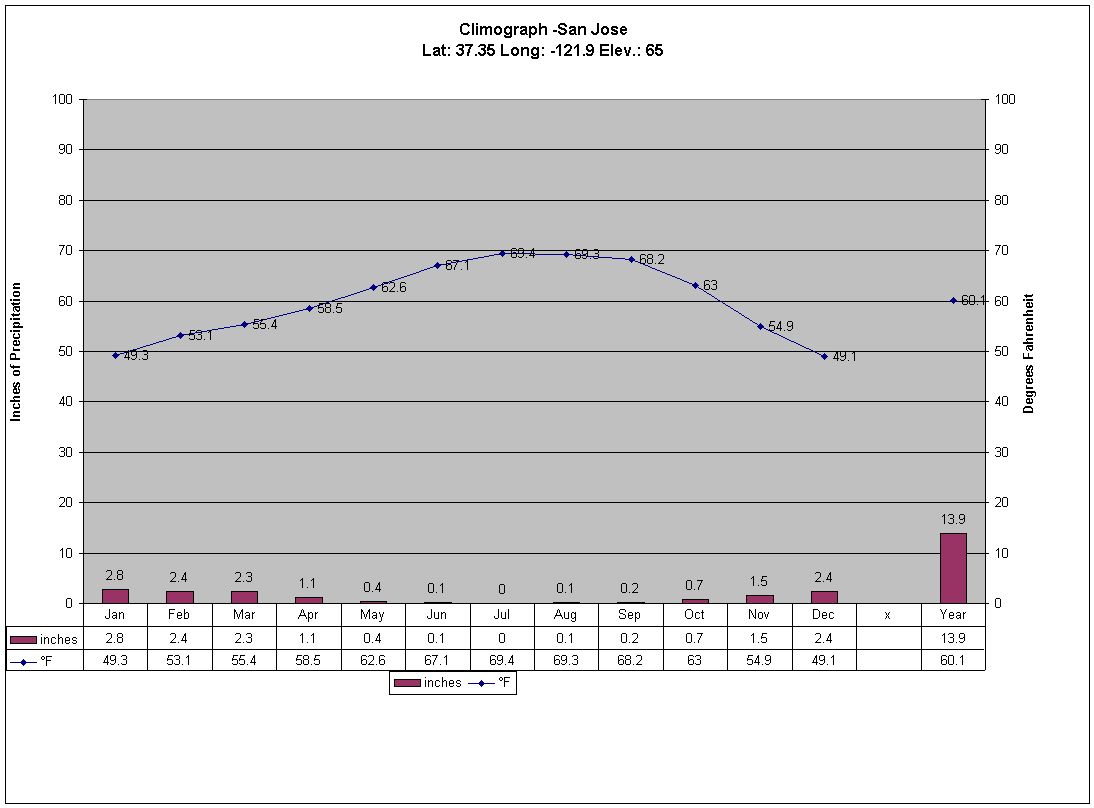
| San Jose |
37.35 |
-121.9 |
65 |
inches |
2.8 |
2.4 |
2.3 |
1.1 |
0.4 |
0.1 |
0 |
0.1 |
0.2 |
0.7 |
1.5 |
2.4 |
|
13.9 |
|
°F |
49.3 |
53.1 |
55.4 |
58.5 |
62.6 |
67.1 |
69.4 |
69.3 |
68.2 |
63 |
54.9 |
49.1 |
|
60.1 |
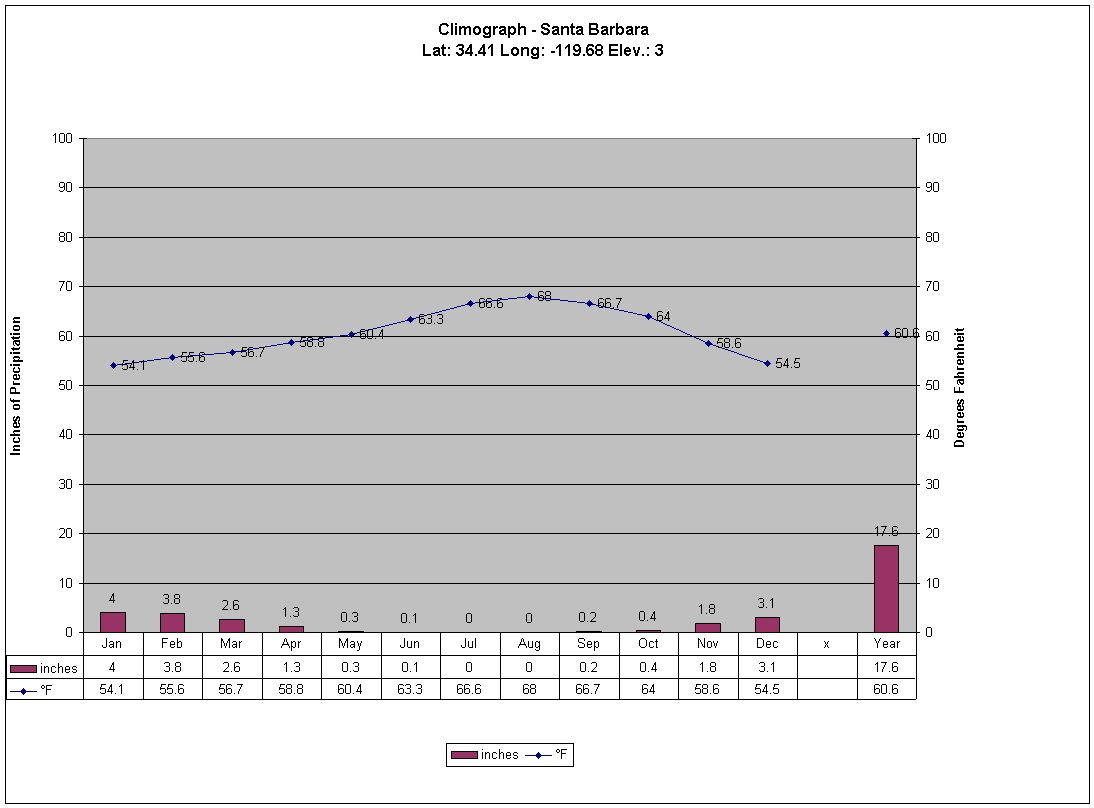
| Santa Barbara |
34.41 |
-119.68 |
3 |
inches |
4 |
3.8 |
2.6 |
1.3 |
0.3 |
0.1 |
0 |
0 |
0.2 |
0.4 |
1.8 |
3.1 |
|
17.6 |
|
°F |
54.1 |
55.6 |
56.7 |
58.8 |
60.4 |
63.3 |
66.6 |
68 |
66.7 |
64 |
58.6 |
54.5 |
|
60.6 |
| Tahoe |
39.17 |
-120.1 |
6230 |
inches |
5.8 |
5.3 |
4.1 |
2.1 |
1.1 |
0.7 |
0.3 |
0.3 |
0.6 |
1.8 |
3.8 |
5.4 |
|
31.4 |
|
°F |
28.2 |
29.8 |
32.5 |
37.9 |
45.7 |
53.2 |
60.4 |
59.7 |
53.4 |
44.6 |
36 |
30.4 |
|
42.6 |
| Yosemite Park |
37.75 |
-119.58 |
3963 |
inches |
6.2 |
6.1 |
5.2 |
3.2 |
1.5 |
0.6 |
0.4 |
0.2 |
0.7 |
1.6 |
4.2 |
6.6 |
|
36.4 |
|
°F |
37.2 |
41.5 |
44.6 |
50.2 |
57.2 |
64.9 |
71.6 |
71.2 |
65.5 |
56.5 |
44.2 |
36.9 |
|
53.4 |
Some Climographs from the rest of the World
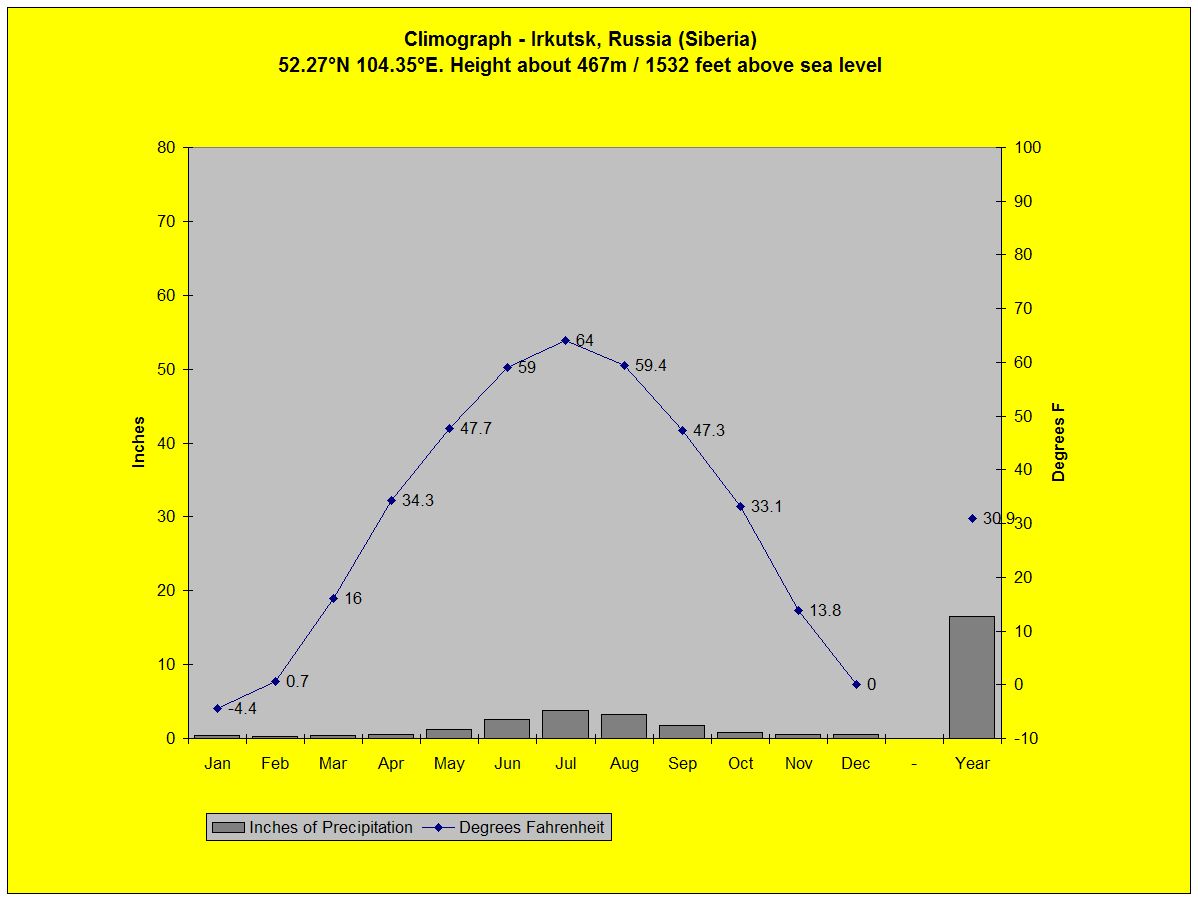
Use these to compare California climates to other places around the globe. Make sure you note the scales on the right and left vertical (Y) axes.
Consider how the the proximity (how close) each of these places are to: 1) an ocean, 2) the Equator 3) the Tropic of Cancer or Capricorn.
- Africa - Cairo, Egypt
- Africa - Lukasa, Zambia
- Africa - Nairobi, Kenya
- Asia - Calcutta, India
- Asia - Chennai (Madras), India
- Asia - Jakarta, Indonesia
- Asia - Irkutsk, Russia
- Australia - Sydney
- Europe - Rome, Italy
- South America - Buenos Aries, Argentina
- South America - Manaus, Brazil
- United States - Honolulu, Hawai'i
- United States - Kansas City, Missouri
-

