

CSUN Economic and Social Impact Study
Conclusion

As one of Southern California’s premier universities, CSUN has had a significant impact on both the economy and quality of life of the region, though its impact extends much farther. First, CSUN generates a substantial amount of economic activity through its operations. In total, CSUN-related expenditures generated an estimated $1.9 billion in economic output statewide during the 2013/2014 academic year and supported more than 11,700 jobs for California residents. Of the $1.9 billion in total statewide output, nearly $1.6 billion was sourced from Los Angeles County. Additionally, of the 11,700 plus jobs created statewide, nearly 10,400 jobs originate from Los Angeles County.
CSUN’s operations provide a substantial source of revenue to local businesses. In addition to the impact of CSUN’s direct operational expenditures, student, visitor, and faculty/staff spending also add a substantial amount of value to the local and state economy. Nearly $700 million of the total economic output is in the form of labor income. Subtracting out money spent on inputs, CSUN-related expenditures added more than $1.0 billion in value to the economy of California, of which nearly $900 million came directly from Los Angeles County. CSUN-related expenditures also provide a crucial source of tax revenue for local and state government.
On top of the important role CSUN-related expenditures play in generating economic activity locally and statewide, CSUN’s presence also generates invaluable social benefits for its students, the Northridge area, and the County of Los Angeles. By way of its diverse degree programs and student outreach, the University provides much of its social impact through the knowledge and skills it delivers to its students. CSUN facilitates significant partnerships and training with local businesses and through these programs, students are able to better prepare for the professional world, facilitating their further contribution to the local and state economy. Additionally, the presence of CSUN has had significantly positive employment and demographic effects on the surrounding Northridge area and across Los Angeles County.
Altogether, CSUN’s operations and the many subsequent benefits those operations generate provide a strong and very positive impact on the economy and quality of life in Los Angeles County and California.
Appendix: Economic Impact methodology
IMPLAN Input-Output Model
The input-output model used for this study is IMPLAN. The IMPLAN modeling system combines the benchmark input-output accounts of the U.S. Bureau of Economic Analysis with other data to construct quantitative models of trade flow between businesses, and between businesses and final consumers. From these data we can examine the effects of a change in one or several economic activities to estimate the outcome on a specific state, regional, or local economy (impact analysis). The IMPLAN input-output accounts capture all monetary market transactions for consumption in a given time period. The IMPLAN input-output accounts are based on industry survey data collected periodically by the U.S. Bureau of Economic Analysis and follow a balanced account format recommended by the United Nations.
IMPLAN’s Regional Economic Accounts and the Social Accounting Matrices were used to construct state-level multipliers, which describe the response of the relevant state economy to a change in demand or production as a result of expenditures made by CSUN, its employees, students, and visitors. Each industry that produces goods or services generates demand for other goods and services, and this demand is multiplied through a particular economy until it dissipates through “leakage” to economies outside the specified area. IMPLAN models discern and calculate leakage from local, regional, and state economic areas based on workforce configuration; the inputs required by specific types of businesses; and the availability of inputs in the economic area. Consequently, economic impacts that accrue to other regions or states as a result of a change in demand are not counted as impacts within the economic area.
The IMPLAN model accounts for substitution and displacement effects by deflating industry-specific multipliers to levels well below those recommended by the U.S. Bureau of Economic Analysis. Additionally, when estimating the impact of household spending, multipliers are applied only to personal, disposable income to obtain a more realistic estimate of the multiplier effects generated by increased demand. Significantly, IMPLAN’s Regional Economic Accounts exclude imports to an economic area, thus the calculation of economic impacts identifies only those impacts specific to the economic impact area, as determined by the purchasing patterns of the industries where changes in output are occurring. IMPLAN calculates this distinction by applying the area’s economic characteristics described in terms of actual trade flows within the area. The current version of IMPLAN not only identifies what proportion of inputs are purchased locally, but also determines from where inputs are sourced which, subsequently, are not obtained within the local economic area. This enables a user to estimate the impact of a spending decrease in one economy on other nearby economies and to determine how increased economic activity in those areas in turn impact the original study area.
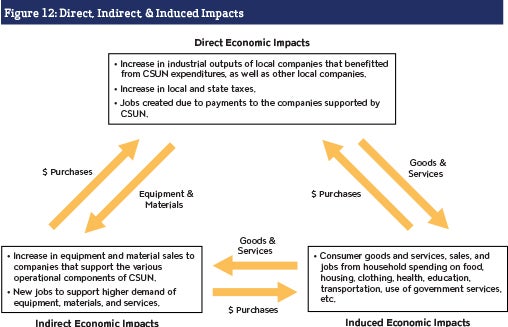
Impact studies operate under the basic assumption that any increase in spending has three effects: First, there is a direct effect on that industry itself, resulting from the increase in output of goods or services. Second, there is a chain of indirect effects on all the industries whose outputs are used by the industry under observation. These are the impacts generated by a business’s supply chain. Third, there are induced effects that arise when employment increases and household spending patterns increase. These impacts follow from the increase in wages in the course of increasing this output, both by employees in the target industry and in those supplying it.
There are several components to the overall economic impact. First, there is an effect on value added–in this analysis, the net increase in the overall value of the local economy. Value added represents the total increase in an industry’s output omitting the value of any intermediate inputs, and it is commonly used to measure an industry’s contribution to local gross product. Value added consists primarily of labor income, but also includes indirect business taxes and other property income. The secondary and tertiary effects of the industry on the rest of the local economy are not very large. Second, there is an impact on local employment, with the single-largest share of jobs gained in the industry itself and the others spread throughout the study area’s economy. Third, there is the increase in economic output, where the difference between value added and output is that the former concentrates on various earnings, while the latter includes the value of intermediate inputs. National income accounting avoids double counting by excluding the value of intermediate inputs.
It is also important to note that capital investments made on different types of projects can lead to different multipliers. Why? A sector can have a large multiplier if it induces economic activity in industries whose employees have a high propensity to spend from take-home pay. Also, if the sector does not import many materials from abroad or from out of state, then its multiplier effect on the local economy will be high. In essence, some of the spending in the local economy may “leak out” into other states and countries. If raw materials are imported, a change in a local sector’s level of production will result in a commensurate change in economic activity abroad. The same is true if a California business buys inputs from firms in different states.
Beacon Economics’ analysis using input-output accounts is based on three important assumptions: One, there are constant returns to scale. This means that a 10% increase in expenditures will be ten times as great–across every sector in the economy–as a 1% increase. Two, there are no supply constraints. This means that any marginal increase in output can be produced without having to worry about bottlenecks in labor markets, commodity markets, or necessary imports. This assumption is realistic in a free-market economy like California’s where there is significant unemployment. It is even more reasonable in times of high unemployment because there are many underutilized resources that can be activated without detracting from other industries or businesses. Three, the flow of commodities between industries is fixed. This means that it is not possible to substitute in the short-run the many different inputs that go into the target industry.
The IMPLAN model is the model of choice in conducting an economic impact analysis and most accurately portrays the economic benefits in a given geographic region due to increased expenditures.
Derivation of input estimates
Geographic Scope and
Time Period
In all economic impact studies, the input-output model—IMPLAN in this case—is calibrated for a specific geographic region. Since CSUN is located in Los Angeles County and the majority of the University’s economic activity is centered in the County, for this analysis, IMPLAN was calibrated for the County of Los Angeles.
This analysis also includes an examination of the impact CSUN has on the local economy. The Northridge local area comprises four ZIP codes within Los Angeles County (91324, 91325, 91326, and 91343). In order to capture the local impacts, we calibrated IMPLAN specifically to the four ZIP codes that comprise the Northridge area.
Finally, this analysis includes an assessment of impacts across the State of California. These illustrate the residual impacts that remain when we expand the geographic scope to cover the entire state.
The input estimates and resulting output analysis contained in this report are based on financial and expenditure data from the 2013/2014 academic year—the most up-to-date data available. The output estimates are expressed in 2015 dollars, however, not 2014.
University Expenditures
To derive the appropriate input estimates related to CSUN’s expenditures, we use CSUN’s Report of Financial Activity for the 2013/2014 academic year. From this report, we sum the total operating expenditures from all university and auxiliary departments. Traditional university impact studies would assign a single multiplier (pertaining to university operations) as a means of estimating the economic impacts. This methodology, however, would not provide an accurate account of the economic impacts reflecting university expenditures. In this study, we assign each expenditure line item with the most applicable North American Industry Classification System (NAICS) code. Based on these NAICS codes, we select the IMPLAN sector code that best applies to each NAICS code. As there are far fewer IMPLAN sector codes than NAICS industries, the various expenditure items are consolidated into the IMPLAN sector code that most closely reflects the listed expenditure item.
This methodology is crucial to the study, as each expenditure line item pertains to different industries whose purchasing patterns differ from one another. This in turn results in different multiplier effects. If we were to only assign a single multiplier to this study, we would be either overestimating or underestimating the impacts, depending on the expenditure category. Assigning unique NAICS codes (and most applicable IMPLAN sector code) to each expenditure item eliminates this inaccuracy, thereby producing credible impact estimates. University expenditures totaled approximately $505.4 million during the 2013/2014 academic year.
For this analysis, CSUN’s capital expenditures were provided by the University’s Administration and Finance Department. CSUN’s capital expenditures include all construction projects across the University. Given that CSUN’s capital expenditures are tied to construction activities, we assign the total capital expenditures to the Construction NAICS code and corresponding IMPLAN sector code.
Furthermore, as the construction projects are ongoing, the impacts stemming from the capital expenditures represent the aggregate impacts the local region will accrue over the entire construction period. For example, when we estimate the economic impact of the $74 million in capital expenditures related to construction of the extended learning building and the new student housing, they represent the total impacts over the course of the entire construction period. In all, CSUN spent approximately $133.6 million on capital expenditures during the 2013/2014 academic year.
Capital Expenditures
All capital expenditures were based on the Report of Financial Activity provided by CSUN.
Employee Salary Expenditures
The total salary and wages paid to all university and auxiliary employees were derived from CSUN’s Report of Financial Activity for the 2013/2014 academic year. In order to determine the effect on the local economy from the salaries of employees—who include faculty, administrative staff, and all other full-time university staff—it is important to understand how these sets of workers are likely to spend their income.
This is critical to the analysis because spending in some sectors generates larger impacts than others due to a variety of factors including the wages paid in the target industry, the availability of intermediate inputs within the target geographic area, and the propensity of workers throughout the supply chain to spend from their own take-home pay. Because of these nuances, the economic impact analysis presented here also includes an analysis of spending patterns by CSUN employees using data from the Bureau of Labor Statistics’ Consumer Expenditure Survey (CES).
The CES is one of the most comprehensive sources for detailed household expenditures and demographic characteristics in the United States. It is the only federal survey that collects data on the complete range of consumer expenditures and income, as well as the demographic characteristics of those consumers. The CES consists of the Quarterly Interview Survey and the two-week Diary Survey, which is conducted once per year. The survey conducted for the Bureau of Labor Statistics by the U.S. Census Bureau is frequently used by government agencies, as well as by business and academic researchers to study the impact of policies on economic groups. Perhaps one of the most important uses is to track expenditure shares from survey data for use in revising the Consumer Price Index basket of goods and their relative significance.
The expenditure shares obtained from the CES represent the full spectrum of products and services that exhaust a consumer’s disposable income. A hierarchical structure is used, where the expenditure shares of the main categories add up to 100% and the subcategories of a main category add up to the percentage share of each category. For example, from the third quarter of 2013 to the second quarter of 2014 all consumer units, on average, spent 13.7% of their disposable income on food, which can be further broken down into 7.7% of disposable income spent on food at home (such as groceries) and 6.0% spent on food away from home (such as eating out at restaurants). This hierarchical structure allows us to model consumer behavior in a very detailed fashion for more accurate results.
The consumption categories and associated expenditure shares are then mapped to industry sectors in the IMPLAN modeling system. Using the food example above, 7.7% of the estimated disposable income is mapped to the food and beverage retail sector, and 6.0% is mapped to the food services sector. This detailed mapping of consumer expenditures is valuable for accurate results because each industry sector in the regional economy will behave differently with respect to how they spend revenue, thus yielding a different economic multiplier for that sector in the IMPLAN modeling system.
| Table A: Consumer Spending Patterns and Amounts | ||||
|---|---|---|---|---|
| Category | Share of Total (%) | Corresponding Amount ($) | ||
| Shelter | 19.8 | 46,958,010 | ||
| Transportation | 12.6 | 29,882,370 | ||
| Pension | 10.1 | 23,953,328 | ||
| Food at Home | 7.7 | 18,261,448 | ||
| Utilities | 7.4 | 17,549,963 | ||
| Food Away and Alcohol | 6.0 | 14,229,700 | ||
| Gasoline and Motor Oil | 4.9 | 11,620,922 | ||
| Health Insurance | 4.8 | 11,383,760 | ||
| Cash Contributions | 3.4 | 8,063,497 | ||
| Apparel and Services | 3.2 | 7,589,173 | ||
| Household Furnishings | 2.9 | 6,877,688 | ||
| Education | 2.2 | 5,217,557 | ||
| Household Operations | 2.1 | 4,980,395 | ||
| Audio Equipment | 1.9 | 4,506,072 | ||
| Medical Services | 1.5 | 3,557,425 | ||
| Miscellaneous | 1.3 | 3,083,102 | ||
| Personal Care | 1.2 | 2,845,940 | ||
| Pets and Toys | 1.2 | 2,845,940 | ||
| Home Supplies | 1.2 | 2,845,940 | ||
| Fees and Administration | 1.1 | 2,608,778 | ||
| Drugs | 0.9 | 2,134,455 | ||
| Other Entertainment | 0.7 | 1,660,132 | ||
| Tobacco Products | 0.6 | 1,422,970 | ||
| Insurance | 0.6 | 1,422,970 | ||
| Medical Supplies | 0.3 | 711,485 | ||
| Reading | 0.2 | 474,323 | ||
| Total | 100.0 | 236,687,345 | ||
| Source: CSUN, IRS, BLS, Beacon Economics | ||||
We applied the increase in disposable income for CSUN employees to consumption categories and associated expenditure shares from the CES, then mapped those values to industry sectors in the IMPLAN modeling system to derive appropriate input estimates.
Student Expenditures
In addition to expenditures made by faculty and staff, student expenditures are an equally important component of this analysis. The difference is that we only take into account students from outside Los Angeles County. Because we assume that many local students would be working in Los Angeles County and making similar expenditures whether or not they were attending CSUN, the more accurate and conservative method in isolating the impact of student spending is to exclude these expenditures from the total. Using this method, we only include student expenditures that represent spending that would not have occurred “but for” the existence of CSUN.
In order to create student expenditure estimates, we used the following student expenditure data provided by CSUN:
- Room and Board
- Transportation
- Personal/Miscellaneous Expenditures
CSUN provided average student expenditure estimates for each type of student (undergraduate or graduate). The expenditures were separated according to whether the student lived with parents, lived on campus (undergraduate only), or lived independently. Since CSUN does not track the living arrangements of its off-campus students (undergraduate and graduate), we used data from the U.S. Census Bureau’s American Community Survey to calculate the share of both undergraduates and graduates who either live with their parents or live independently throughout Los Angeles County.
Using only CSUN students from outside of Los Angeles County, we calculated the total student expenditures (by category) for both undergraduate and graduate students. We assumed that students living with their parents are originally from Los Angeles County and omitted them. We then matched each expenditure category with its most applicable IMPLAN sector code.
| Table B: Composition of CSUN Students Living Off Campus | |||
|---|---|---|---|
| Status | Undergraduate Students | Graduate Students | Total Students |
| Independent | 314,373 | 103,045 | 417,418 |
| Living with Parents | 410,566 | 34,586 | 445,152 |
| Share Independent | 43% | 75% | 48% |
| Share Living with Parents | 57% | 25% | 52% |
| Source: CSUN | |||
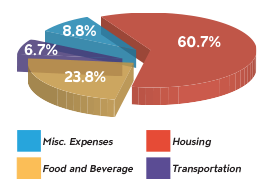
Figure 13: Breakdown of Student Expenditures (AY 2013-14)
Visitor Expenditures
Attempting to reasonably calculate the expenditures that visitors to CSUN would make is often difficult to do. A credible visitor expenditure calculation would consist of calculating only the “new” expenditures that otherwise would not happen ”but for” the presence of CSUN. Given the often-complex nature of calculating the number of visitors to CSUN and determining a reasonable visitor expenditure estimate, we instead calculate only expenditures made by visitors during commencement exercises of the 2013/2014 academic year.
Based on data provided by CSUN, we were able to determine the number of visitors associated with the 2013/2014 commencement exercises. We assumed that only a fraction of CSUN’s commencement visitors were from outside Los Angeles County. Utilizing data identifying the city that each CSUN student is reportedly from, we estimated that 34.4% of undergraduate students and 41.7% of graduate students are from outside Los Angeles County. To ensure a conservative estimate, we utilized the share of undergraduates that live outside of Los Angeles County as the base share to determine the number of commencement attendees from outside the County. Based on this share, we reasonably assume that the same proportion of CSUN graduate commencement participants are from outside Los Angeles County. Using industry-standard visitor spending data, we are able to calculate per-day visitor expenditure estimates and corresponding visitor spending estimates for a typical tourist in Los Angeles County.
| Table C: Estimated Visitors Attending 2014 CSUN for Commencement | ||||
|---|---|---|---|---|
| Category | Metric | |||
| # of Commencement Visitors | 44,509 | |||
| Average Family Size | 3.26 | |||
| % Who are from Outside Los Angeles County | 34.4 | |||
| Estimated CSUN Commencement Visitors | 15,311 | |||
| Source: CSUN, U.S. Census Bureau | ||||