Energy-efficient Workload Management in Datacenters

  • CSUN REU Site Participant: Beth Ann Sweezer, Harold Wang (University of California, San Diego)
  • CSUN SfS2 Participants: Matthew Smith, Brandon Ismalej
  • Master Student Mentor: Venkat Ravala

As the market for cloud-based solutions escalates, it is imperative to streamline its energy consumption. According to the 2023 U.S. Data Center Market Overview [1], the integration of Al across enterprises is the primary driver for this growth. The same report lists energy as the "number one challenge for the data center market”. Data centers (DCs) have moved from traditional HVAC systems to in-row cooling or refrigerant-based heat dissipation, but still have 40% of their energy costs used for cooling [2].

Our research includes three major parts:

  • Build a temperature model to predict outlet temperature of a computer server based on the GPU-intensive workload running on the server
  • Use the GpuCloudSim Plus simulator [3] to leverage the temperature model and apply workload balancing algorithms for task scheduling
  • Integrate a real-world data center workload trace into the GpuCloudSimPlus simulator to evaluate the energy efficiencies of thermal-aware workload scheduling algorithms for GPU-intensive workload

GPU Temperature Model

Problem

Given sequential data across several hours containing information about the computational load of a given computer server, predict the GPU temperature of the server at every second in the sequence.

Data Collection

To understand real-world usage, we analyzed the resource demands and arriving time intervals between task requests of a real datacenter (DC) Analysis of real-world data center workload traces indicated that tasks execution time and requested resources varied

  • We simulated GPU usage under a diverse set of tasks with random task arriving time within specified ranges to mimic traffic patterns.
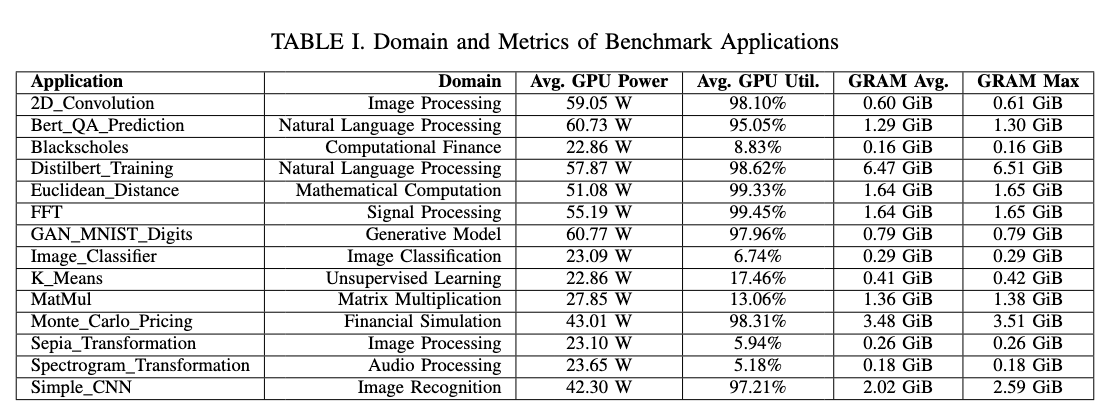
  • We run a series of GPU-intensive benchmarks with various use cases including machine learning, image processing, financial modeling, etc.
  • A service was launched to track the CPU, GPU, RAM, and disk utilization and temperature.
  • Our premise in data collection was to capture the full spectrum of GPU behavior under different task arriving intervals.

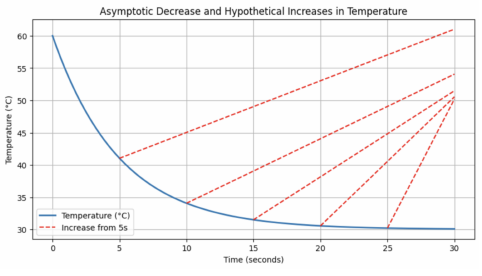
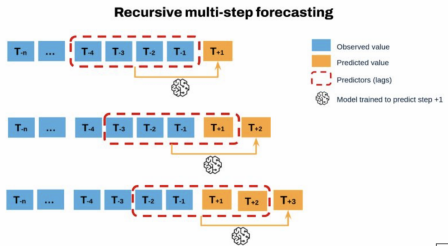
Figure 2. Hypothetical behaviour of GPU temperature.            Figure 3. Recursive Multi-step Forecasting Process[3].

Recursive multi-step forecasting
  • The sequential nature of the data means that temperatures are closely related to adjacent values.
  • Our models leverage either a lagged input or sliding window approach to capture these temporal dependencies.
  • The window-based models used all data from the n previous time steps for an input shape of nxm, with n being window size and m being # of features.
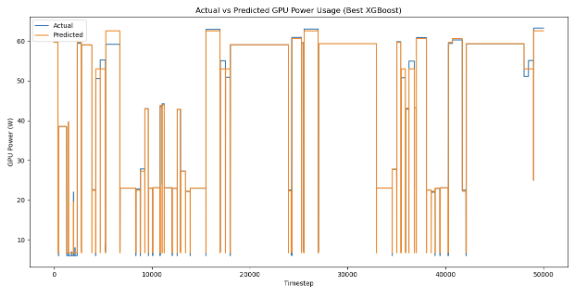
  • Tested 6 model architectures: Long Short-Term Memory (LSTM), XGBoost, CatBoost, LightGBM Transformer, and a hybrid CNN-LSTM model.

Scheduled Sampling

An issue that came up was accuracy for time series forecasting:

  • Teacher forcing: In training, models accessed the real temperature from previous time steps, causing an overreliance on lagged features. In prediction, models only accessed the generated temperature of previous time steps, leading to compounding error.
  • Scheduled Sampling (SS): Gradually transition from using the correct output (target sequence) as inputs to using the model's own predictions. This method made the model more robust to mistakes during inference, as it learned to rely on lag features less.
  • With scheduled sampling, we reduced RMSE by over 50% across all models

Through the testing of new model architectures, scheduled sampling training, and extensive hyperparameter tuning, we reduced the RMSE from the existing temperature model by an estimated 90%.


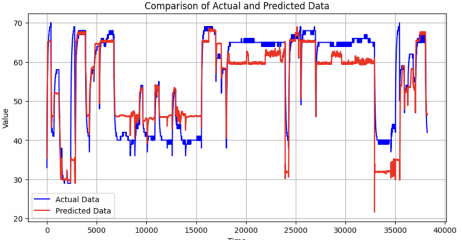
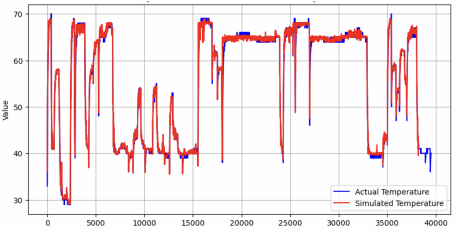
Figure 4. Actual vs. Simulated temperature by an initial model.            Figure 5. Actual vs Simulated temperature by scheduled sampling-trained hybrid model.

GPU Energy Prediction


A set of 14 diverse, GPU-intensive benchmark scripts were utilized, covering a wide range of applications. These benchmark scripts and the derived inter-task delay times were employed to synthesize GPU workload data through 5 controlled experiments.

Machine Learning Models

This work examines the accuracy of four machine learning model architectures for GPU power prediction:

  • GBoost (eXtreme Gradient Boosting): XGBoost is a scalable tree boosting system that is notable for its use in winning solutions in machine learning competitions.
  • CatBoost (Categorical Boosting): CatBoost is a gradient boosting toolkit that employs ordered boosting and a unique strategy for categorical feature handling, enabling its comparable performance to existing gradient boosting im- plementations.
  • LightGBM (Light Gradient-Boosting Machine): LightGBM is an implementation of the gradient boosting decision tree with the added features of Gradient-based One-Side Sampling and Exclusive Feature Bundling, which allow this algorithm to handle a large amount of data instances and input features.
  • LSTM (Long Short-Term Memory): LSTM is a type of Recurrent Neural Network (RNN) that was designed to overcome the limitations that traditional RNN’s pose, particularly the challenge of learning long-term dependencies in sequences of data. The architecture of LSTM permits the network to capture and leverage long-term dependencies more effectively than traditional RNNs.


Experiments

In this study, overlapping tasks were excluded to ensure compatibility with the experimental server configuration, which was equipped with only a single GPU, and of the 14 benchmarks used for experimentation, 8 resulted in high GPU utilization. Five experiments were executed to gather synthesized data to mimic the statistical characteristics of real-world GPU workloads, as derived from the Alibaba and Helios traces. This approach simulates diverse scenarios, promoting generalization and preventing overfitting. A set of 14 GPU-intensive applications were run in each experiment, resulting in roughly 40 hours of collected GPU data. The applications with their resource and power metrics are shown in Table I.


The generated data for all experiments was compiled into a single CSV file, with the following GPU features extracted for each task: GPU power average [W], GPU utilization average [%], GRAM average [GiB], GRAM maximum [GiB], denoted as Pavg , Uavg , GRAMavg , and GRAMmax, respectively. GPU metric data were averaged over each task and idle period, reflecting the practical availability of only task-average features in workload traces. The three selected features align with the limited data available from the Alibaba cluster trace, providing a realistic constraint suitable for integration with the GPUCloudSim Plus simulator.


GPU Power Prediction

A 60/20/20 split of the data was implemented for training, testing, and validation, respectively. The performance for these models is measured using the metric of Root Mean Square Error (RMSE). As the performance of all models implemented was compa- rable, with an RMSE difference of 0.302 between the highest and lowest performing models, hyperparameter tuning was conducted using grid search. Among the models, XGBoost emerged as the best performer with the lowest RMSE of 1.217. CatBoost was a close contender with an RMSE of 1.218. While all models showed com- parable performance, XGBoost’s ability to minimize RMSE by capturing complex feature interactions, such as spikes and dips in power usage, made it the most favorable choice for this application. The performance of our best performing XGBoost model is illustrated in the following figure.

Real-world Workload Trace


Alibaba Cluster Trace: cluster-trace-gpu-v2020 [7] provides a GPU cluster trace of AI/ML workloads from their Platform for Al. This trace provides extensive data from a large server cluster compromising over 6,500 GPUs, spanning approximately 1,800 machines. The information from the GPU workload trace will be imported into the GpuCloudSimPlus to create the parameters for our hosts, virtual machines, and the cloudlets.

A modified version of the GpuCloudSimPlus [3] architecture, which was an integration of CloudSimPlus[5] and GPUCloudSim provisioners [6], was used to simulate a cloud computing infrastructures and evaluate the energy consumption of task scheduling algorithms. The delay creation of submitted VMs and Cloudlets, enabling simulation topologies of dynamic arrival of tasks. It also allows dynamic creation of VMs and Cloudlets in runtime, enabling VMs to be created on-demand. The listeners enable simulation configuration, monitoring and data collection.

Steps for using the Alibaba Workload Traces in the GPUCloudSimPlus simulator:

  • Find start time of the simulation, and adjust workload trace times
  • Modify the clock listener to assign VMs according to workload trace
  • Modify the clock listener to schedule the server diagnostic prediction using ML
  • Modify the workload balancing algorithms (from Cloudlet level to VM level)
    • Original way: Cloudlets → VMs (VMs are assigned at start)
    • New way: VMs → Hosts
      • VMs created by users, Cloudlets are launched within a user's VM

Conclusion and Future Work

The insights gained from overhauling every component of the temperature model, from data collection, to model architecture, to training process, will help to inform future GPU forecasting models, namely outlet temperature and holistic energy cost. Scheduled sampling, as a concept, has reinforced the importance of robust training methods in improving model performance. By fitting our model in a manner that conceptually emulates the simulation setting of GPUCloudSim Plus, we achieved a notably higher accuracy in temperature prediction, accurately informing potential temperature-aware load balancing efforts in a future downstream task. There has been progresses on integrating the new model and the workload trace into our simulator, but results are still forthcoming.

Reference

[1] 2023 U.S. Data Center Market Overview & Market Clusters. Newmark. https://www.nmrk.com/insights/market-report/2023-u- s-data-center-market-overview-market-clusters

[2] Heslin, K. (2015, July 30). A look at Data Center Cooling Technologies. Uptime Institute Blog. https://journal.uptimeinstitute.com/a-look-at-data-center-cooling-technologies/

[3] M. Smith, L. Zhao, J. Cordova, X. Jiang and M. Ebrahimi, "Machine Learning-Based Energy-efficient Workload Management for Data Centers," 2024 IEEE 21st Consumer Communications & Networking Conference (CCNC), Las Vegas, NV, USA, 2024, pp. 799- 802, doi: 10.1109/CCNC51664.2024.10454842.

[4] Amat Rodrigo, J., & Escobar Ortiz, J. (2024). skforecast (Version 0.12.1) [Computer software]. https://doi.org/10.5281/zenodo.8382788

[5] M. C. Silva Filho, R. L. Oliveira, C. C. Monteiro, P. R. M. Inácio and M. M. Freire, "CloudSim Plus: A cloud computing simulation framework pursuing software engineering principles for improved modularity, extensibility and correctness," 2017 IFIP/IEEE Symposium on Integrated Network and Service Management (IM), Lisbon, Portugal, 2017, pp. 400-406, doi: 10.23919/INM.2017.7987304.

[6] A. Siavashi, and M. Mahmoud. "GPUCloudSim: an extension of CloudSim for modeling and simulation of GPUs in cloud data centers." The Journal of Supercomputing 75, no. 5 (2019): 2535-2561.

[7] Alibaba Cluster Trace. https://github.com/alibaba/clusterdata/blob/master/cluster-trace-gpu-v2020

Acknowledgements

This project is supported by the National Science Foundation under Grant CNS-2244391, the SECURE For Student Success (SfS2) Program funded by the United States Department of Education FY 2023 Title V, Part A, Developing Hispanic-Serving Institutions Program five-year grant, Award Number P31S0230232, CFDA Number 84.031S, and The Louis Stokes Alliance for Minority Participation--LSAMP Program funded by the National Science Foundation and the California State University System.