Project 3
The purpose of this project was to choose 7 items and compare 4 similar variables among them. Since I'm a vanilla shake fanatic, I decided to choose 7 fast food places that served vanilla shakes. The 4 variables I compared were: calories, total fat, cholesterol, and sodium. An interpretation as well as the sources of the data can be found below the graph.
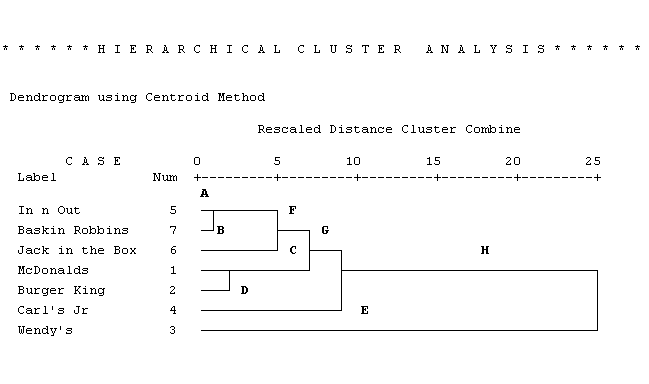
Starting at about Distance 1 are Clusters A, B, C, D, & E.
Cluster A consists of In n Out and Baskin Robbins.
Cluster B consist of Jack in the Box.
Cluster C consists of McDonalds and Burger King.
Cluster D consists of Carl’s Jr.
Cluster E consists of Wendy’s.
At about distance 5, Clusters A and B merge to form Cluster F.
Clusters C and F merge to form
Cluster G.
At about distance 10, Clusters D
and G merge to form H.
Cluster H does not join Cluster E
until the end.
Overall, the greatest number of
segments possible is 5 (Clusters A, B, C, D, & E) at Distance 1
Overall, if one must divide these alumni into 2 reliable clusters, those 2 segments would be Cluster E (consisting of Wendy’s) and Cluster H (consisting of everything else).
References:
http://www.mcdonalds.com/app_controller.nutrition.item.1806.html
http://www.burgerking.com/Food/Nutrition/NutritionWizard/index.aspx
http://www.wendys.com/food/index.jsp?country=US&lang=EN
http://www.in-n-out.com/html/frm_b3a.html
http://www.jackinthebox.com/ourfood/list.php
http://www.baskinrobbins.com/about/nutrition/Product.aspx?Category=Beverages&id=BV033