
In the formulae above, a value is assigned for each variable in the corresponding cells. Then, calculations are performed based on predetermines ratios already set up in the spread sheet.
Temperature Conversion- You can alter the input value for Farenheit and the answer will calculate the conversion to Celsisus.
Object in Freefall- Gravity is the constant. Here, the input or variable value is the diameter of the object.
Universal Law of Gravitation- Gravitational force can be found if the mass and size of the object is known.
Statistics- When given a volume, this formula can calculate the value (L) for multiple statistical calculations.
Escape Velocity- This formula allows the user to enter a velocity and then the formula will determine if this velosity is great enough. A simple, yes/no response is provided.

The fastest human is 2,198 times faster than the average snail.
The fastest human can only travel 3/100 the speed of sound.

Starting Values

Multiple Values


Company Y contributes more to global warming. (852,450kg vs 144,150kg)


Air pollution trends in your area:

Ozone pollution shows the same daily fluxuations in each region. The valley, however, has the most extreme, and worst, ozone pollution of all three areas.
Air pollution trends in your region
Body size and brain size

Humans are above the trendline.
Classifying Stars

Partner: Jocelyn
The sun is a main sequence star.
Sunspots

The number of sun spots per year appear to rise and fall in a cyclical pattern. The sun undergoes a drastic spike and then drop in sun spots approximately every five years.

Is boiling point a periodic property? Yes
Is melting point a periodic property? Yes
Is atomic mass a periodic property? No
Is first ionization energy a periodic property? Yes
Is electron affinity a periodic property? Yes

How did life expectancy change during the last century? Life expectancy has been increasing with time. This is most likely due to advances in medicine and technology.
What are trends in the causes of death? Tuberculosis is not a significant threat anymore. Cancer is slowly and steadily rising as a likely cause of death. While cardiovascular disease is currenlty on a down fall, it is still, and has always been, the greatest cause of death.
Rare and endangered species

Endangered species of lants are the quickest to multiply. Birds fall in the middle, and reptiles are slow to rebuild their populations. This could be due to the method and time fram within which plants are able to reproduce.
Biology: Population profiles

The population profile of Germany is more closely related to that of a developed country such as the United States.
Ecology: Wolf repopulation in Yellowstone

When wolves were reintroduced into yellowstone (1995) the population of wolves within the park grew while that outside of the park experienced a decrease in numbers.
Environmental Science: Rechargeable batteries

Earth science: Seawater composition

Ecology: Threatened and endangered species.
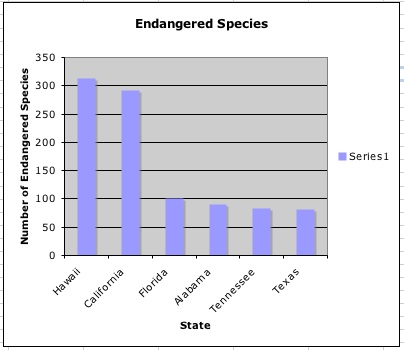
California and Hawaii have the greatest number of endangered species. This could have occured for several reasons, including climate. All of the top states listed are found in fairly temperate climates, perhaps this contributes to species survival.
What is the universe made of?

What is the atmosphere made of?

What is the sun made of?

What are humans made of?

Physiology: Is blood type distribution the same for all ethnicities?

It is interesting to note that Navajo do not show blood types AB or B. Further, Koreans have the widest distribution of all blood types.
What are the causes of death in developing and developed countries?

Which biomes are most productive?

Tropical rainforests have the highest amount of productivity per unit of space. Therefore, if rainforest damage continues, the biome's reduced productivity will affect the environment on a large scale.
Sources of energy:

Only 7.4% of our current resources come from renewable sources.
Seed germination

Commercial Satellite launches

How does a continental climate differ from a maritime climate?

The graphs suport the climatologists prediction because Denver has wider highs and lows, as well as temperatures across a greater range. San Francisco appears to have a more consistent and stable climate.
Analyzing climates with climographs
Create a climograph for a city close to you

The climate in Los Angeles is fairly equable in terms of temperature. It experiences dry summers and wet winters.
How does species diversity and biomass change with elevation

Do radioactive elements decay in an exponential manner

Yes, Strontium-90 experiences exponential decay, as seen in the regression curve and the constant slop of the log graph.


