
| Project Expenditures | Amount |
|---|---|
| Direct Cost | $16,421,466 |
| Indirect Cost | $2,267,946 |
| Total | $18,689,412 |
| Indirect Cost Recovery Rate | Percent |
|---|---|
| Recovered Indirect Cost in % of Direct Cost | 13.8% |
| FY 2008/2009 Period 1-12 July 1, 2008 - June 30, 2009 | Current Year FY 2008/2009 | Previous Year FY 2007/2008 | |||||||
| Actual vs. Budget | Annual Budget | Same Period | |||||||
| Actual | Budget | Diff. | Budget | Achiev. | Actual | Diff. | |||
| ($000) | ($000) | ($000) | in % | ($000) | in % | ($000) | ($000) | in % | |
| 1. Sponsored Programs Activity | |||||||||
| 1.1Direct Cost | 16421 | 14750 | 1671 | 11% | 14750 | 111% | 16160 | 261 | 2% |
| 1.2Indirect Cost | 2268 | 1770 | 498 | 28% | 1770 | 128% | 2289 | -21 | -1% |
| 1.3Total SP-Cost | 16689 | 16520 | 2169 | 13% | 16520 | 113% | 18449 | 240 | 1% |
| 2. Indirect Cost Rate | |||||||||
| 2.1Average IDC-Rate | 13.8% | 12.0% | 12.0% | 14.2% | |||||
| 3. Net Available to Campus | |||||||||
| 3.1Recovered IDC (=1.2) | 2268 | 1770 | 498 | 28% | 1770 | 128% | 2289 | -21 | -1% |
| 3.2- TUC-Service Fee (3.9%) | 729 | 644 | 85 | 13% | 644 | 113% | 729 | 10 | 1% |
| 3.3- Expense Dept. 24100 | 480 | 507 | -27 | -5% | 507 | 95% | 430 | ||
| 3.4- Expense Dept. 24150 | 97 | 94 | 3 | 3% | 94 | 103% | 85 | ||
| 3.5- Add. SP Reserve (10%) | 96 | 52 | 44 | 83% | 52 | 183% | 105 | ||
| 3.6 =Net Available to Campus | 866 | 472 | 394 | 83% | 472 | 183% | 949 | -83 | -10% |
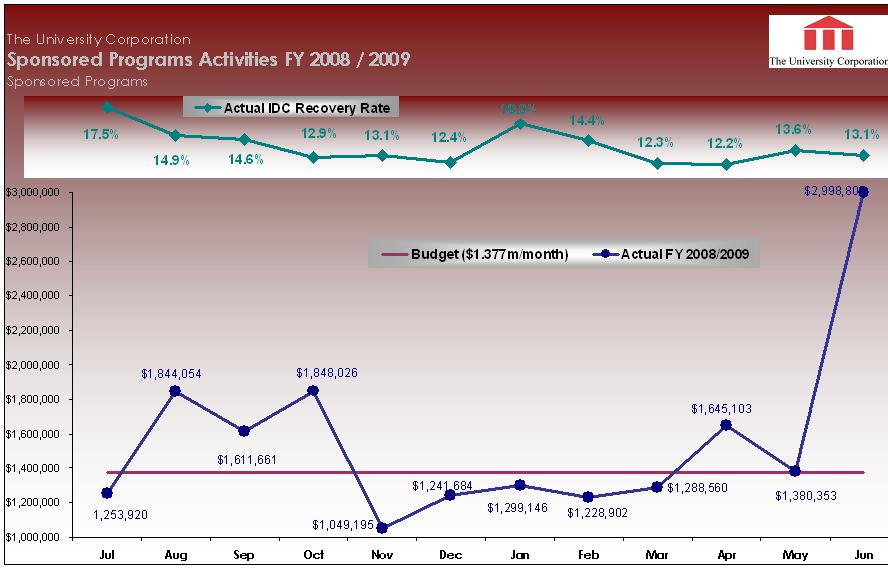
| Monthly Expenditures, FY 2008/2009 | July | August | September | October | November | December | January | February | March | April | May | June | Total |
|---|---|---|---|---|---|---|---|---|---|---|---|---|---|
| Actual | |||||||||||||
| Direct | 1067234 | 1605154 | 1406073 | 1637065 | 927450 | 1104936 | 1119964 | 1073764 | 1147277 | 1465654 | 1215488 | 2651405 | 16421466 |
| Indirect | 186686 | 238900 | 205588 | 210961 | 121744 | 136747 | 179182 | 155138 | 141283 | 179449 | 164865 | 347403 | 2267946 |
| Total | 1253920 | 1844054 | 1611661 | 1848026 | 1049195 | 1241684 | 1299146 | 1228902 | 1288560 | 1645103 | 1380353 | 2998808 | 18689412 |
| IDC-Rate | 17.5% | 14.9% | 14.6% | 12.9% | 13.1% | 12.4% | 16.0% | 14.4% | 12.3% | 12.2% | 13.6% | 13.1% | 13.8% |
| Budget | 1376666 | 1376666 | 1376666 | 1376666 | 1376666 | 1376666 | 1376666 | 1376666 | 1376666 | 1376666 | 1376666 | 1376666 | 1376666 |
| Difference | -122,746 | 467388 | 234995 | 471360 | -327471 | -134982 | -77520 | -147764 | -88106 | 268437 | 3687 | 1622134 | 2169412 |
| Original Source of Funds | Direct Cost | Indirect Cost | Percent | Total | Percent |
|---|---|---|---|---|---|
| Federal Government (including pass-through from non-federal grantors) | 13,581,971 | 1,994,106 | 86.4 | 15,574,084 | 83.3 |
| State Government | 321,174 | 33,825 | 1.5 | 354,999 | 1.9 |
| Local Government | 1,639,958 | 115,838 | 5.1 | 1,755,796 | 9.4 |
| Other | 878,363 | 124,177 | 5.5 | 1,002,540 | 5.4 |
| Total | 16,421,466 | 2,267,946 | 100.0% | 18,689,412 | 100.0% |
| Orginal Source of Funds - By Agency (including pass-through from non-federal grantors) | Total | Percent |
|---|---|---|
| Federal | ||
| US Department of Health and Human Services (DHHS) | 6,139,819 | 32.9% |
| US Department of Education (ED) | 5,071,874 | 27.1% |
| National Science Foundation (NSF) | 2,415,533 | 12.9% |
| US Department of Justice (DOJ) | 422,008 | 2.3% |
| US Department of Defense (DOD) | 629,214 | 3.4% |
| Corporation for National and Community Service | 254,308 | 1.4% |
| US Department of Labor (DOL) | 449 | 0% |
| US Department of Energy (DOE) | 206,318 | 1.1% |
| US Department of Agriculture (USDA) | 0 | 0% |
| National Aeronautics and Space Administration (NASA) | 244,336 | 1.3% |
| National Endowment for the Humanities | 10,000 | 0.1% |
| US Department of Commerce (DOC) | 41,879 | 0.2% |
| US Agency for International Development (USAID) | 10,012 | 0.1% |
| US Department of the Interior (DOI) | 1,549 | 0% |
| US Department of Treasury | 69,264 | 0.4% |
| US Department of Transportation | 33,521 | 0.2% |
| Department of Homeland Security | 24,000 | 0.1% |
| Total Federal Funds | 15,574,084 | 83.3% |
| State | 354,999 | 1.9% |
| Other | 2,760,329 | 14.8% |
| Total | 18,689,412 | 100% |
| Total Project Expenditures by Account | |||
|---|---|---|---|
| Salaries & Wages | 8,283,220.29 | ||
| Benefits | 1,555,095.98 | ||
| Total Personnel Cost | 9,838,316.27 | 52.6% | |
| Supplies | |||
| Office Supplies | 140,934.04 | ||
| Computer Supplies | 464.37 | ||
| Operational Supplies | 21,736.21 | ||
| Instructional-Book Supplies | 68,433.31 | ||
| 231,567.93 | |||
| Program Costs | 796,110.30 | ||
| Insurance | 304.50 | ||
| Printing and Photocopy | 28,167.47 | ||
| Publication Charges | 1,094.70 | ||
| Postage | 1,471.53 | ||
| Equipment Lease | 125,385.26 | ||
| Equipment Rental | 5,015.57 | ||
| Facility Rental | 10,014.50 | ||
| Hospitality | 20,084.05 | ||
| Dues | 15.00 | ||
| Subscriptions | 7,017.19 | ||
| Professional & Contract Services | |||
| Professional Services | 3,954.84 | ||
| Contract Services | 662,410.32 | ||
| Audit Services | 2,300.00 | ||
| Computer Systems Support | 28,630.92 | ||
| Web-Online Services | 23,700.00 | ||
| Training-Development Svcs | 92,856.60 | ||
| 813,852.68 | |||
| Subcontractor Svcs-University | 554,941.18 | ||
| Subcontractor Svcs-Non Profit | 298,552.57 | ||
| Subcontractor Svcs-For Profit | 128,124.75 | ||
| Subcontracts | 981,618.50 | 5.3% | |
| Travel | 405,398.45 | ||
| In State Travel | 45,962.55 | ||
| Out of State Travel | 28,227.91 | ||
| Out of Country Travel | 51,966.42 | ||
| Seminar-Conference Fee | 7,174.46 | ||
| Ground Transportation | 14,491.00 | ||
| Meals | 37,184.92 | ||
| Travel Expenses | 590,405.71 | ||
| Telephones | 35,644.16 | ||
| Answering Services | 16,777.18 | ||
| Pager Services | 292.15 | ||
| Electricity | 14,358.83 | ||
| Gas | 1,322.87 | ||
| Equip-Facility R and M | 17,559.52 | ||
| Handling Fees | 2,272.23 | ||
| Bank Charges | 72.97 | ||
| Stipends-Student | 1,416,884.24 | ||
| Stipends-Non-Student | 193,305.59 | ||
| Tuition-Books | 265,736.90 | ||
| Student Housing | 93,657.17 | ||
| Grant Event Costs | 2,260.59 | ||
| Participant Incentive Award | 43,226.69 | ||
| Participant Travel | 125,866.78 | ||
| Stipends | 2,672,493.29 | 14.3% | |
| Expendable Equipment | 306,364.03 | ||
| Minor Capital Equipment | 82,213.45 | ||
| Major Capital Equipment | 351,216.00 | ||
| Equipment | 739,793.48 | ||
| Total Operational Cost | 6,587,970.29 | 35.2% | |
| Total Direct Cost | 16,426,286.56 | 87.9% | |
| Indirect Cost | 2,267,946.43 | 12.1% | |
| Total Cost | 18,694,232.99 | 100.0% |
| Expenditures by College | Total | Percent |
|---|---|---|
| College of Science and Mathematics | 6,228,817.37 | 33% |
| College of Education | 4,875,549.54 | 26% |
| University Administration | 1,555,716.14 | 8.3% |
| College of Social and Behavioral Sciences | 1,774,378.40 | 9.5% |
| College of Business and Economics | 508,666.30 | 2.7% |
| College of Engineering & Computer Science | 778,016.01 | 4.2% |
| National Center on Deafness | 2,130,513.58 | 11.4% |
| College of Health & Human Development | 533,106.37 | 2.9% |
| Oviatt Library | 30,675.11 | 0.22% |
| College of Arts, Media, & Communication | 66,624.98 | 0.4% |
| College of Humanities | 207,348.20 | 1.1% |
| Total | 18,689,412.00 | 100% |
| Student Involvement in Sponsored Programs | Number of Employees | Number of Work Hours | Total Wages | Average Hourly Rate |
|---|---|---|---|---|
| Student Assistants (Undergraduate) | 237 | 71,361 | 794,291.74 | 11.13 |
| Graduate Assistants | 13 | 6,645 | 89,342.32 | 13.44 |
| Graduate Research Assistants | 14 | 6,106 | 91,852.98 | 15.04 |
| Total | 264 | 84,112 | 975,487.04 | 11.60 |