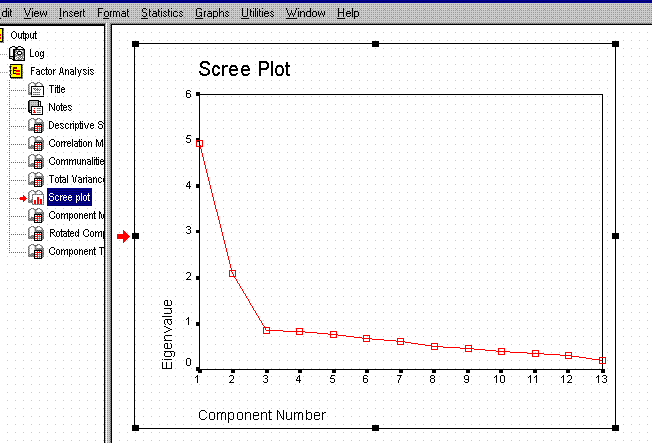
Scree Plot of the Eigen Values.
Notice how the scree ("rubble") starts after Component 2 in this example.
The criterion is that any factor with an eigen value of less than 1.00
is scree (trash).
The Scree Plot merely provides
a visual representation of the table of eigen values.