Energy-efficient Workload Management in Datacenters

  • CSUN REU Site Participant: Mark Fullton (College of the Canyons), Kousha Salimkhan
  • CSUN SfS2 Participants: Josh Penaojas, Henry Locke
  • Master Student Mentor: Chongye Wang, Matthew Smith
  • Faculty Advisor: Xunfei Jiang, Mahdi Ebrahimi, Xiaojun Ruan (CSU-East Bay)

AI systems are increasing workload in data centers. Data centers consumed 415 TWh of electricity (1.5% of global energy consumption) in 2024, and IEA believes this will double by 2030 [1]. 40% of energy consumed is attributed to cooling infrastructure [2]. Water is also a significant cost for cooling datacenters. For example, training ChatGPT-3 consumed approximately 700,000 liters of water [3].

Our research includes three major parts:

  • Build a temperature model to predict outlet temperature of GPU
  • Use the GpuCloudSim Plus simulator [3] to leverage the temperature model and apply workload balancing algorithms for task scheduling
  • Integrate a real-world data center workload trace into the GpuCloudSimPlus simulator to evaluate the energy efficiencies of thermal-aware workload scheduling algorithms for GPU-intensive workload

GPU Temperature Model

Problem

Given sequential data across several hours containing information about the computational load of a given computer server, predict the GPU temperature of the server at every second in the sequence.

Model Building Approach

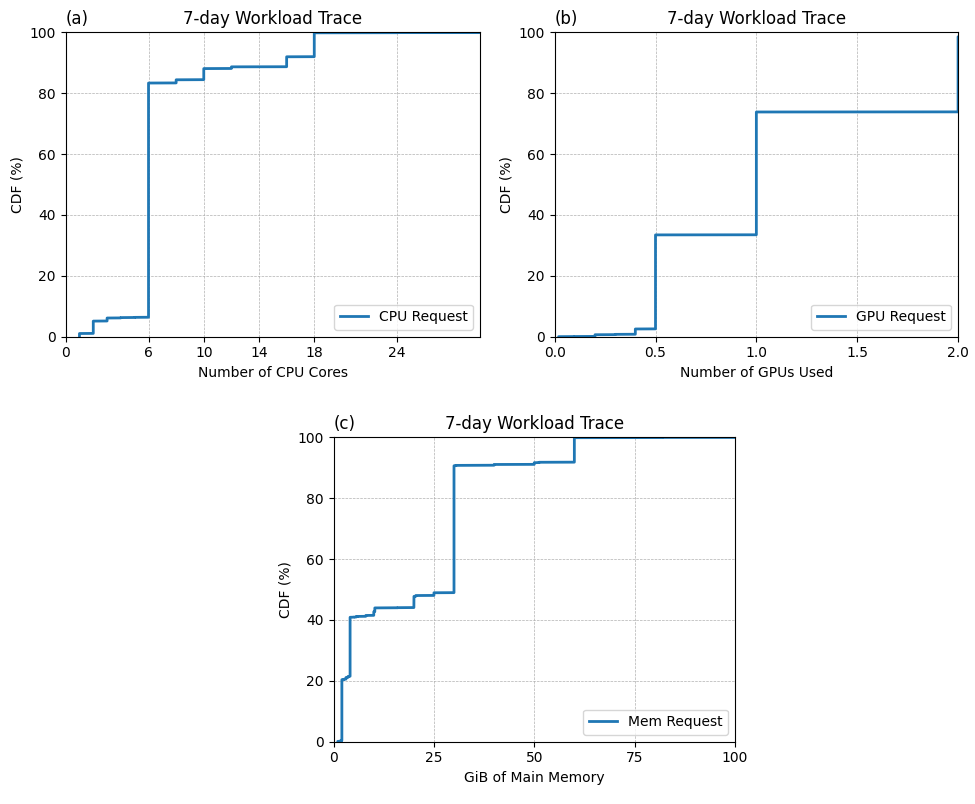
To understand real-world usage, we analyzed the resource demands and arriving time intervals between task requests of a real datacenter (DC) Analysis of real-world data center workload traces indicated that tasks execution time and requested resources varied.

  • Implement Baseline models (e.g., CNN-BiLSTM, Transformer, Informer, PatchTST, Pathformer, XGBoost) without optimization
  • Create variants using scheduled sampling, attention forcing, and physics-informed losses
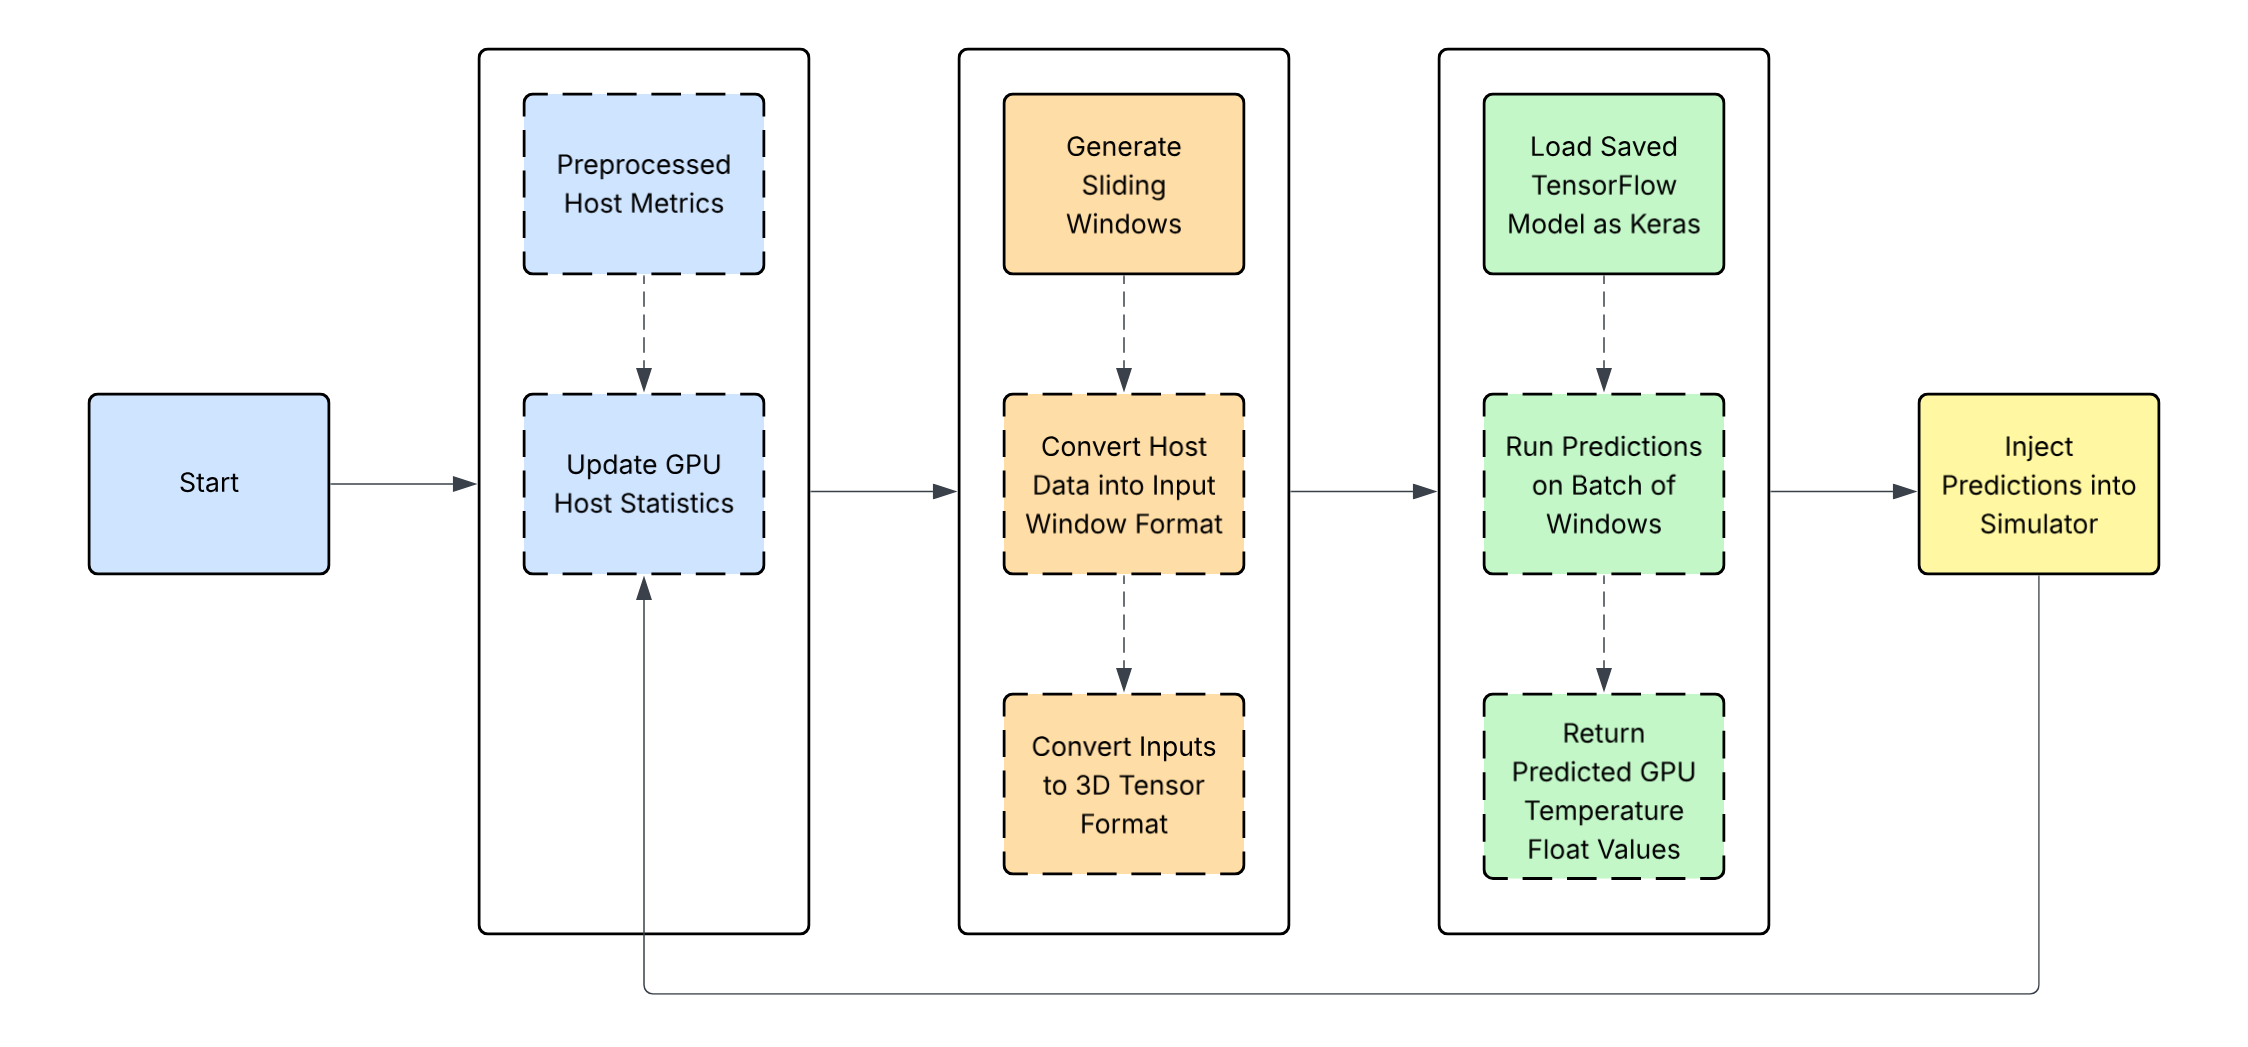
  • Export models to ONNX and evaluate autoregressively (AR) in a Java environment.
  • Check integrity by comparing ground-truth-based outputs cross-platform
  • Training and inference times, power consumption, and predictions were recorded.
  • Analyze results using the Friedman test, followed by Wilcoxon tests with Bonferroni correction

Friedman Test: Detected a difference in model performance (p-value: 0.0001})
Input Window Size: Window sizes of 3-50 tested on all models; 5 resulted in best AR RMSE
Input Features: CPU Average Temperature, CPU Average Utilization, GPU Average Utilization, GPU Average Power (W), GPU GRAM Average (gib), GPU temperature

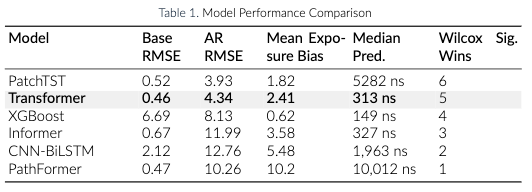
Table I shows the comparison of the model performance for baseline models. Figure 1 and 2 show the comparison of GPU prediction using ground truth values, autoregressive, and non-autoregressive approach with Transformer model and the CNN-BiLSTM model.


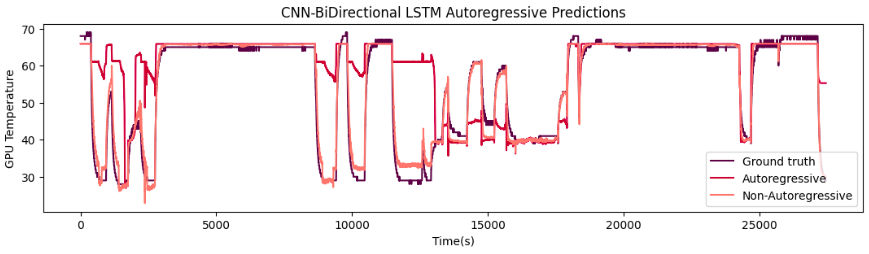
Figure 1. Transformer GPU Temperature predictions                                                   Figure 2. CNN-BiLSTM GPU Temperature predictions

Machine Learning Model Integration Pipeline


Figure 3. Data pipeline for integrating GPU temperature predictions into the simulator.

  • Simulation Start: Each simulation tick begins by collecting stats of active hosts.
  • Host Metrics Processing: Host metrics data are preprocessed, and host statistics are updated.
  • Window Generation: Recent time steps are grouped using a sliding window to create structured input segments.
  • Input Preparation: The windowed host data is reshaped into a 3D tensor format for batch model input.
  • Model Execution: A saved TensorFlow model is loaded, and predictions are generated for each input batch.
  • Output Handling: Predicted GPU temperature values for hosts are returned as float arrays.
  • Simulation Update: Predicted temperatures are injected into the simulator, which continues to the next tick using the updated values.

  • Redesign of the GPU CloudSim Plus Simulator

    Architecture: To simulate cloud computing environments and assess the energy efficiency of load balancing algorithms, a modified version of the GpuCloudSimPlus [3] architecture, which was an integration of CloudSimPlus[5] and GPUCloudSim provisioners [6], was used to simulate a cloud computing infrastructures and evaluate the energy consumption of task scheduling algorithms. The delay creation of submitted VMs and Cloudlets, enabling simulation topologies of dynamic arrival of tasks. It also allows dynamic creation of VMs and Cloudlets in runtime, enabling VMs to be created on-demand. The listeners enable simulation configuration, monitoring and data collection.

  • Datacenter Simulation: Hosts, VMs, and cloudlets mimic real-world task scheduling scenarios.
  • Dynamic Resource Provisioning: VMs and cloudlets can be created during runtime to model elastic cloud environments.
  • Real-time Metrics Monitoring: Event listeners enable statistics tracking and data collection for analysis.

  • Steps for using the Alibaba Workload Traces in the GPUCloudSimPlus simulator:

    • Find start time of the simulation, and adjust workload trace times
    • Modify the clock listener to assign VMs according to workload trace
    • Modify the clock listener to schedule the server diagnostic prediction using ML
    • Modify the workload balancing algorithms (from Cloudlet level to VM level)
      • Original way: Cloudlets → VMs (VMs are assigned at start)
      • New way: VMs → Hosts
        • VMs created by users, Cloudlets are launched within a user's VM

    Real-world Workload Trace


    Alibaba Cluster Trace: cluster-trace-gpu-v2020 [7] provides a GPU cluster trace of AI/ML workloads from their Platform for Al. This trace provides extensive data from a large server cluster compromising over 6,500 GPUs, spanning approximately 1,800 machines. The information from the GPU workload trace will be imported into the GpuCloudSimPlus to create the parameters for our hosts, virtual machines, and the cloudlets.

    We filtered the Alibaba Cluster 2020 Workload Trace by removing the following instances: (1) instances that were not running on a machine using a T4 GPU; (2) instances that did not have a valid start and end time; (3) instances’ tasks that have no planned CPU, GPU, or RAM usage; (4) instances that miss sensor or resource data; and (5) instances that requested for CPUs and GPUs, but did not use one or the other. We run a simulation with the 7-day workload trace (as shown in Fig. 7) , a subset of the filtered workload instances whose start time falls into the first 7 days. This workload trace has 18,683 instances and they took 12 days in total for completion.

    Figure 5. Evaluation Workload Trace Instance Distribution.                 Figure 6. Instance Resource Request Cumulative Distribution Function (CDF)

    Conclusion and Future Work

    The insights gained from overhauling every component of the temperature model, from data collection, to model architecture, to training process, will help to inform future GPU forecasting models, namely outlet temperature and holistic energy cost. Scheduled sampling, as a concept, has reinforced the importance of robust training methods in improving model performance. By fitting our model in a manner that conceptually emulates the simulation setting of GPUCloudSim Plus, we achieved a notably higher accuracy in temperature prediction, accurately informing potential temperature-aware load balancing efforts in a future downstream task. There has been progresses on integrating the new model and the workload trace into our simulator, but results are still forthcoming.

    Reference

    [1] 2023 U.S. Data Center Market Overview & Market Clusters. Newmark. https://www.nmrk.com/insights/market-report/2023-u- s-data-center-market-overview-market-clusters

    [2] Heslin, K. (2015, July 30). A look at Data Center Cooling Technologies. Uptime Institute Blog. https://journal.uptimeinstitute.com/a-look-at-data-center-cooling-technologies/

    [3] M. Smith, L. Zhao, J. Cordova, X. Jiang and M. Ebrahimi, "Machine Learning-Based Energy-efficient Workload Management for Data Centers," 2024 IEEE 21st Consumer Communications & Networking Conference (CCNC), Las Vegas, NV, USA, 2024, pp. 799- 802, doi: 10.1109/CCNC51664.2024.10454842.

    [4] Amat Rodrigo, J., & Escobar Ortiz, J. (2024). skforecast (Version 0.12.1) [Computer software]. https://doi.org/10.5281/zenodo.8382788

    [5] M. C. Silva Filho, R. L. Oliveira, C. C. Monteiro, P. R. M. Inácio and M. M. Freire, "CloudSim Plus: A cloud computing simulation framework pursuing software engineering principles for improved modularity, extensibility and correctness," 2017 IFIP/IEEE Symposium on Integrated Network and Service Management (IM), Lisbon, Portugal, 2017, pp. 400-406, doi: 10.23919/INM.2017.7987304.

    [6] A. Siavashi, and M. Mahmoud. "GPUCloudSim: an extension of CloudSim for modeling and simulation of GPUs in cloud data centers." The Journal of Supercomputing 75, no. 5 (2019): 2535-2561.

    [7] Alibaba Cluster Trace. https://github.com/alibaba/clusterdata/blob/master/cluster-trace-gpu-v2020

    Acknowledgements

    This project is supported by the National Science Foundation under Grant CNS-2244391 and the SECURE For Student Success (SfS2) Program funded by the United States Department of Education FY 2023 Title V, Part A, Developing Hispanic-Serving Institutions Program five-year grant, Award Number P31S0230232, CFDA Number 84.031S.