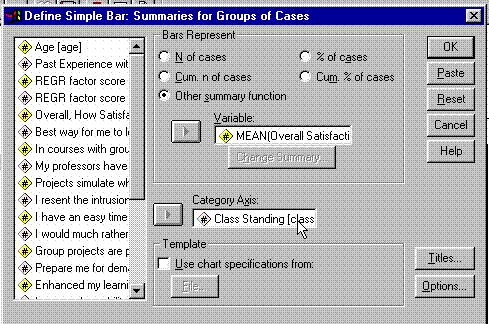
To produce a bar graph showing the mean satisfaction index scores of freshman vs. sophomores vs. juniors vs. seniors.
 To produce a bar graph showing the
mean satisfaction index scores of freshman vs. sophomores vs. juniors vs.
seniors.
To produce a bar graph showing the
mean satisfaction index scores of freshman vs. sophomores vs. juniors vs.
seniors.