Think Payday Lending isn't out of control in the United States?
Compare the number of payday lenders in your state against the number of McDonald's restaurants in your state.
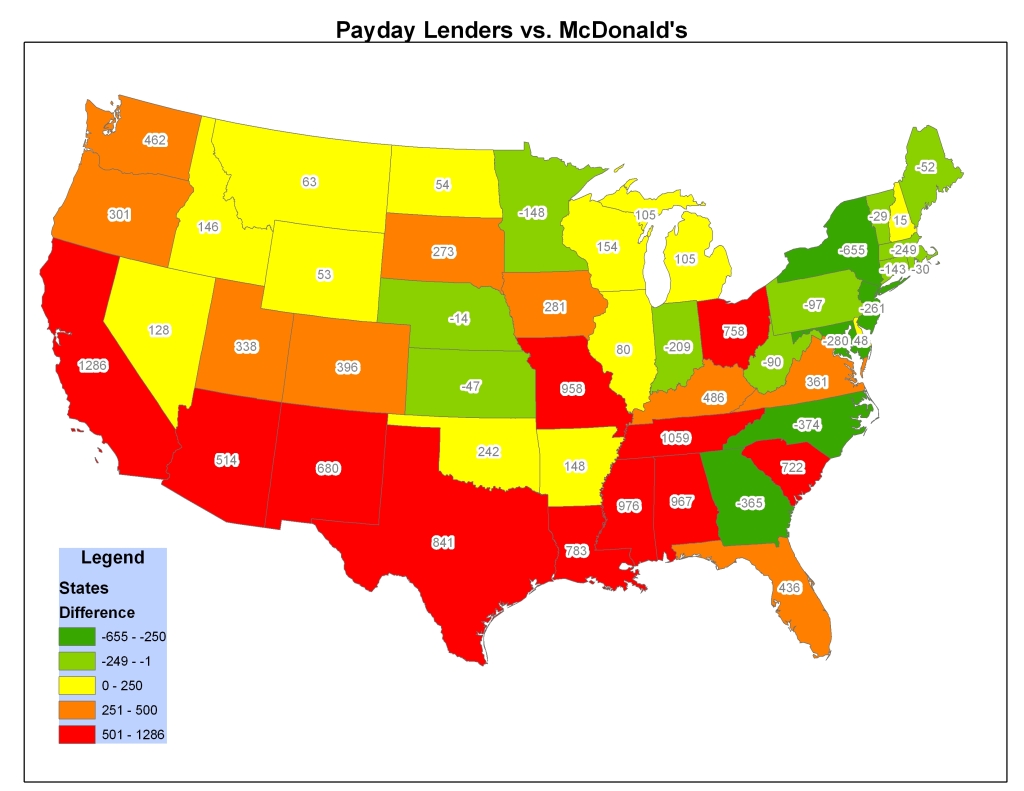
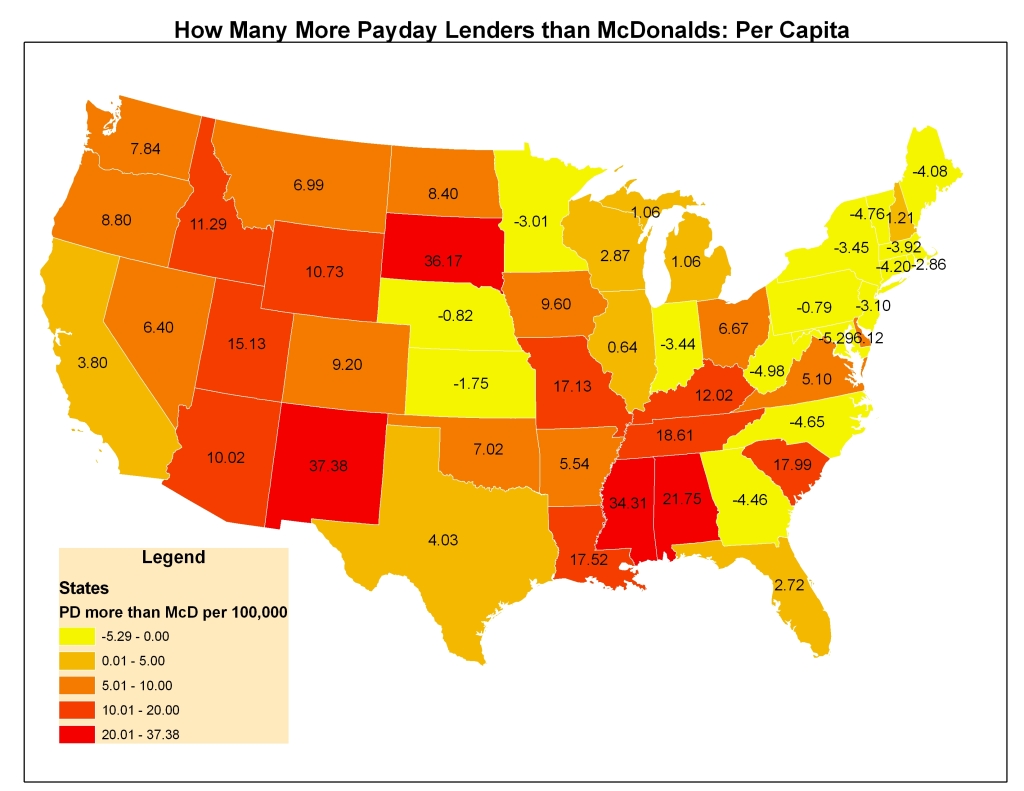
While California is worst in terms of the sheer excess of payday lenders (see green columns), more interesting are those states with massive per capita densities of payday lenders (see yellow columns).
Most states awash with payday lenders have high percentages of poor and/or minority citizens, like Mississippi, Alabama, South Dakota and New Mexico. Politicians in these states are generally quite supportive of the payday lending industry.
In many New England states, charging 300 to 1000+% interest on a loan is still a crime.
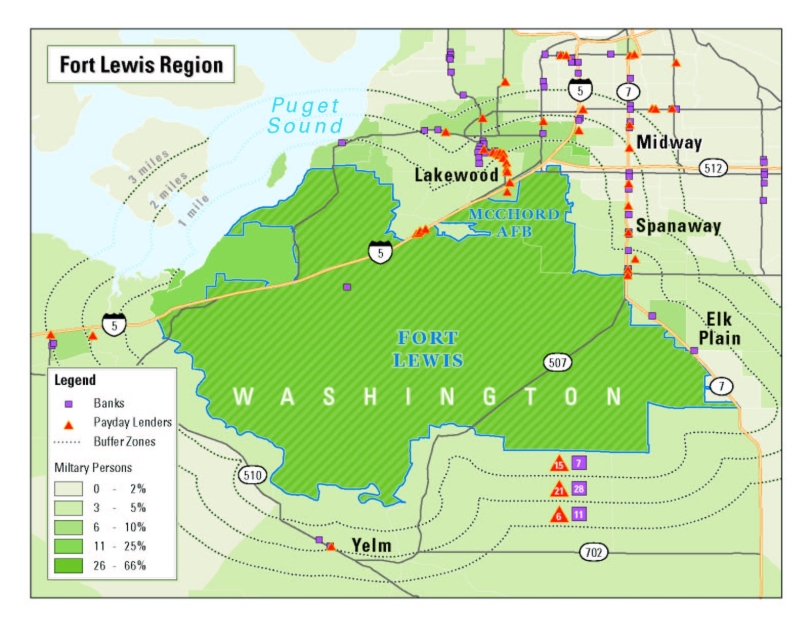
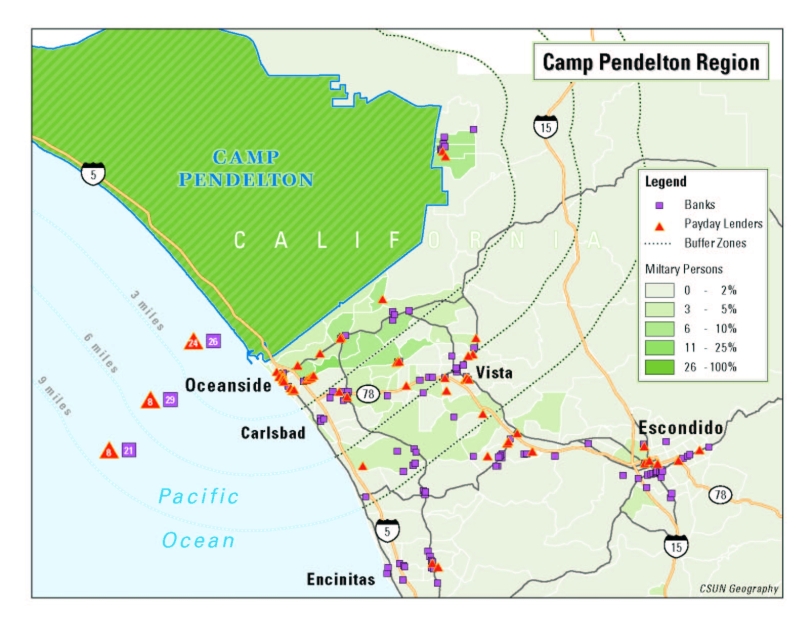
Georgia and North Carolina have recently outlawed payday lending, in part to protect military personnel in their states, who like the poor folks and minorities, are favorite targets of payday lenders.
Want proof? Map their locations and see where they set up shop. The map doesn't lie.
Would you like to see a map of this sad situation?
Click here for a map of the green columns below.
Click here for map of the yellow columns below.
Click here to see a map of payday lenders near a military base: Fort Lewis and McChord AFB or Camp Pendleton
*Data acquired for the maps and this chart are largely from the regulatory authority in each state listed. However, some states have poor data, or no data, so estimates were gathered from newspaper accounts, or the payday lending industry itself. Some estimates may not be accurate.
| STATE | Number of McDonald's | Number of Payday Lenders | How many more Payday Lenders? | RANK | Payday Lenders Per 100,000 | McDonald's per 100,000 | Difference | Rank |
| Alabama | 210 | 1,177 | 967 | 4 | 26.47 | 4.72 | -21.75 | 4 |
| Alaska | 27 | 22 | -5 | 33 | 3.51 | 4.31 | 0.80 | 34 |
| Arizona | 212 | 726 | 514 | 11 | 14.15 | 4.13 | -10.02 | 13 |
| Arkansas | 127 | 275 | 148 | 23 | 10.29 | 4.75 | -5.54 | 24 |
| California | 1,165 | 2,451 | 1286 | 1 | 7.24 | 3.44 | -3.80 | 27 |
| Colorado | 181 | 577 | 396 | 15 | 13.41 | 4.21 | -9.20 | 15 |
| Connecticut | 143 | - | -143 | 42 | 0.00 | 4.20 | 4.20 | 45 |
| Delaware | 34 | 82 | 48 | 31 | 10.46 | 4.34 | -6.12 | 23 |
| Florida | 728 | 1,164 | 436 | 14 | 7.28 | 4.56 | -2.72 | 29 |
| Georgia | 365 | - | -365 | 48 | 0.00 | 4.46 | 4.46 | 46 |
| Hawaii | 76 | 26 | -50 | 38 | 2.15 | 6.27 | 4.12 | 44 |
| Idaho | 50 | 196 | 146 | 24 | 15.15 | 3.86 | -11.29 | 11 |
| Illinois | 647 | 727 | 80 | 27 | 5.85 | 5.21 | -0.64 | 32 |
| Indiana | 326 | 117 | -209 | 44 | 1.92 | 5.36 | 3.44 | 40 |
| Iowa (corrupt data?) | 131 |
412 (in dispute) |
281 | 19 | 14.08 | 4.48 | -9.60 | 14 |
| Kansas | 147 | 100 | -47 | 37 | 3.72 | 5.47 | 1.75 | 36 |
| Kentucky | 221 | 707 | 486 | 12 | 17.49 | 5.47 | -12.02 | 10 |
| Louisiana | 226 | 1,009 | 783 | 7 | 22.58 | 5.06 | -17.52 | 7 |
| Maine | 58 | 6 | -52 | 39 | 0.47 | 4.55 | 4.08 | 43 |
| Maryland | 280 | - | -280 | 47 | 0.00 | 5.29 | 5.29 | 50 |
| Massachusetts | 249 | - | -249 | 45 | 0.00 | 3.92 | 3.92 | 42 |
| Michigan | 545 | 650 | 105 | 26 | 6.54 | 5.48 | -1.06 | 31 |
| Minnesota | 203 | 55 | -148 | 43 | 1.12 | 4.13 | 3.01 | 38 |
| Mississippi | 124 | 1,100 | 976 | 3 | 38.67 | 4.36 | -34.31 | 3 |
| Missouri | 299 | 1,257 | 958 | 5 | 22.47 | 5.34 | -17.13 | 8 |
| Montana | 41 | 104 | 63 | 28 | 11.53 | 4.54 | -6.99 | 20 |
| Nebraska | 71 | 57 | -14 | 34 | 3.33 | 4.15 | 0.82 | 35 |
| Nevada | 128 | 256 | 128 | 25 | 12.81 | 6.41 | -6.40 | 22 |
| New Hampshire | 62 | 77 | 15 | 32 | 6.23 | 5.02 | -1.21 | 30 |
| New Jersey | 261 | - | -261 | 46 | 0.00 | 3.10 | 3.10 | 39 |
| New Mexico | 80 | 760 | 680 | 10 | 41.78 | 4.40 | -37.38 | 1 |
| New York | 655 | - | -655 | 50 | 0.00 | 3.45 | 3.45 | 41 |
| North Carolina | 374 | - | -374 | 49 | 0.00 | 4.65 | 4.65 | 47 |
| North Dakota | 22 | 76 | 54 | 29 | 11.83 | 3.43 | -8.40 | 17 |
| Ohio | 616 | 1,374 | 758 | 8 | 12.10 | 5.43 | -6.67 | 21 |
| Oklahoma | 155 | 397 | 242 | 21 | 11.51 | 4.49 | -7.02 | 19 |
| Oregon | 152 | 453 | 301 | 18 | 13.24 | 4.44 | -8.80 | 16 |
| Pennsylvania | 497 | 400 | -97 | 41 | 3.26 | 4.05 | 0.79 | 33 |
| Rhode Island | 35 | 5 | -30 | 36 | 0.48 | 3.34 | 2.86 | 37 |
| South Carolina | 180 | 902 | 722 | 9 | 22.48 | 4.49 | -17.99 | 6 |
| South Dakota | 29 | 302 | 273 | 20 | 40.01 | 3.84 | -36.17 | 2 |
| Tennessee | 285 | 1,344 | 1059 | 2 | 23.62 | 5.01 | -18.61 | 5 |
| Texas | 834 | 1,675 | 841 | 6 | 8.03 | 4.00 | -4.03 | 26 |
| Utah | 89 | 427 | 338 | 17 | 19.12 | 3.99 | -15.13 | 9 |
| Vermont | 29 | - | -29 | 35 | 0.00 | 4.76 | 4.76 | 48 |
| Virginia | 382 | 743 | 361 | 16 | 10.50 | 5.40 | -5.10 | 25 |
| Washington | 251 | 713 | 462 | 13 | 12.10 | 4.26 | -7.84 | 18 |
| West Virginia | 90 | - | -90 | 40 | 0.00 | 4.98 | 4.98 | 49 |
| Wisconsin | 285 | 439 | 154 | 22 | 8.18 | 5.31 | -2.87 | 28 |
| Wyoming | 24 | 77 | 53 | 30 | 15.59 | 4.86 | -10.73 | 12 |
| Total | 12,401 | 23,417 | 11,016 | -- | -- | -- | -- | -- |
| Average | 248 | 468 | 220 | -- | 10.66 | 4.58 | -6.07 | -- |