 Making
Boxplot Graphs:
Making
Boxplot Graphs:
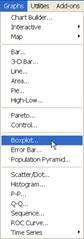
Click on Graphs in the top menu bar of the Data View window. From the drop down menu select Boxplot...>>>
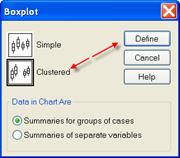
Select Clustered from the Boxplot dialog box then click Define. Note: I left the default radio button checked (Summaries for group cases).
In the Define Clustered Boxplot dialog box move (Plant
Growth) into the Variable: box, Light into the Category Axis: box and
Fertilizer into the Define Clusters by: box. Click on the Options button and in
that dialog box check Display groups defined by missing values then click
Continue.
Clustered boxplot graphs show an interaction between the
light and fertilizer treatments in their effect on plant growth (N. Clifford and
G. Valentine p. 332).
I found several on-line tutorials for how to use SPSS. One
in particular,
Works Cited
Clifford,
Nicholas J., and Gill Valentine. Key Methods in Geography.
, J. Chapman, and Charles B. Monroe. An Introduction To Statistical Problem Solving in Geography. 2nd ed.
SPSS for
Windows: Getting Started. Ed. Information
Technology Services. 13 September 2001. The
SPSS Tutorials. Ed.
Department of Statistics. 2005. College of Science,