Mathematics 150AL, Fall 2003
Assignment 5 -- Local and Global Extrema
An
extremum of a function is either its maximum or its
minimum. A function

 has a local maximum at a point
 if
if
 for all values of
 close to
 .
I.e. the value of
.
I.e. the value of
 at
at
 is larger than or equal to the values of
 at neighboring points. At a local minimum the value of
the function is smaller than at neighboring points.
at neighboring points. At a local minimum the value of
the function is smaller than at neighboring points.
One way to find and classify the
 values
where the extrema of a function occur is to construct first and second
derivative sign charts for the function. The first
derivative sign chart illustrates the intervals for which the first derivative
is positive, negative, zero, and undefined. Similarly, the second derivative
sign chart illustrates the intervals for which the second derivative is
positive, negative, zero, and undefined.
values
where the extrema of a function occur is to construct first and second
derivative sign charts for the function. The first
derivative sign chart illustrates the intervals for which the first derivative
is positive, negative, zero, and undefined. Similarly, the second derivative
sign chart illustrates the intervals for which the second derivative is
positive, negative, zero, and undefined.
Example
Let
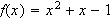 .
Then the first derivative of
.
Then the first derivative of
 is
is
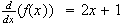 so
the derivative equals
so
the derivative equals
 at
at
 .
It is positive for
.
It is positive for
 and negative for
 .
Thus the first derivative sign chart is:
.
Thus the first derivative sign chart is:

Similarly, the second derivative of
 is
is
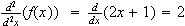 .
Thus, the second derivative never equals
.
Thus, the second derivative never equals
 and is positive for all real
 .
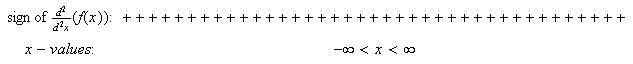
The second derivative sign chart is:
.
The second derivative sign chart is:
The
 values
for which the first derivative equals
values
for which the first derivative equals
 or is undefined are called the critical points of
 .
If the first derivative changes sign from positive to negative about an
.
If the first derivative changes sign from positive to negative about an
 value
for which the first derivative is
value
for which the first derivative is
 ,
the graph has a local maximum at that
,
the graph has a local maximum at that
 value.
If the first derivative changes sign from negative to positive about an
value.
If the first derivative changes sign from negative to positive about an
 value
for which the first derivative is
value
for which the first derivative is
 ,
the graph has a local minimum at that
,
the graph has a local minimum at that
 value.
Another way to determine whether there is a local maximum or a local minimum
at the critical point is to look at the sign of the second derivative. If the
second derivative is negative at that
value.
Another way to determine whether there is a local maximum or a local minimum
at the critical point is to look at the sign of the second derivative. If the
second derivative is negative at that
 value,
the graph has a local maximum at that
value,
the graph has a local maximum at that
 value
and if the second derivative is positive at that
value
and if the second derivative is positive at that
 value,
the graph has a local minimum at that
value,
the graph has a local minimum at that
 value.
When the second derivative changes sign about an
 value
where the second derivative is
value
where the second derivative is
 ,
the graph has an inflection point at that
,
the graph has an inflection point at that
 value.
In our example, the sign of the first derivative changes from negative to
positive about
 ,
so the function has a local minimum of
,
so the function has a local minimum of
 at
at
 .
(Equivalently, the second derivative is positive at
.
(Equivalently, the second derivative is positive at
 so the graph has a local minimum there.) There are no inflection points.
-
Let
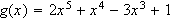 .
.
-
Construct first and second derivative sign charts for
 .
.
-
Use the first derivative sign chart to find all critical points of
 .
.
-
Use the second derivative sign chart to classify each critical point of
 as a local minimum or local maximum.
-
The smallest local minimum of a function is said to be the global minimum and
the largest local maximum is said to be the global maximum. Determine whether
 has a global minimum or global maximum.
-
Use the second derivative sign chart to find all points of inflection of
 .
.
-
If you haven't already, graph
 to confirm your results above. (Be sure to modify the viewing rectangle in
order to see the shape of the graph near the critical points.)
to confirm your results above. (Be sure to modify the viewing rectangle in
order to see the shape of the graph near the critical points.)
-
Now let
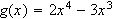 for
for
 .
Use your work in problem 1 to find all local and global minima and maxima of
.
Use your work in problem 1 to find all local and global minima and maxima of
 on this restricted domain. (Hint: Endpoints of the domain are candidates. A
graph may be helpful.)
on this restricted domain. (Hint: Endpoints of the domain are candidates. A
graph may be helpful.)
-
What if you change the domain for
 to be
to be
 ? How
does your answer to part (a) change?
? How
does your answer to part (a) change?
-
Let
-
Construct first and second derivative sign charts for
 .
.
-
Use the first derivative sign chart to find all critical points of
 .
.
-
Use the second derivative sign chart to classify each critical point of
 as a local minimum or local maximum.
-
Determine whether
 has a global minimum or global maximum.
-
Use the second derivative sign chart to find all points of inflection of
 .
.
-
If you haven't already, graph
 to confirm your results above. (Be sure to modify the viewing rectangle in
order to see the shape of the graph near the critical points.)
to confirm your results above. (Be sure to modify the viewing rectangle in
order to see the shape of the graph near the critical points.)
-
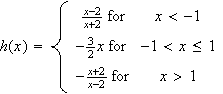
Let
 for
for

-
Use any method to find all points of inflection and all local and global
minima and maxima of
 .
(If you can tell just by looking at the graph, you need not use calculus to
determine the answers. However, be sure to explain how the graph helped you.)
.
(If you can tell just by looking at the graph, you need not use calculus to
determine the answers. However, be sure to explain how the graph helped you.)
This document created by Scientific Notebook 4.0.