 on the rectangular coordinate system. The corresponding equations for these
graphs have been in either rectangular or parametric form. Here we work with
the coordinate system called the polar coordinate
system.
on the rectangular coordinate system. The corresponding equations for these
graphs have been in either rectangular or parametric form. Here we work with
the coordinate system called the polar coordinate
system.
So far, we have been
representing graphs as collections of points
![]() on the rectangular coordinate system. The corresponding equations for these
graphs have been in either rectangular or parametric form. Here we work with
the coordinate system called the polar coordinate
system.
on the rectangular coordinate system. The corresponding equations for these
graphs have been in either rectangular or parametric form. Here we work with
the coordinate system called the polar coordinate
system.
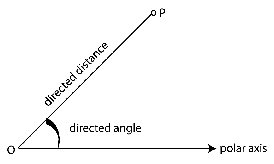
To form the polar coordinate system in the plane, we fix a point
![]()
 ,
called the origin, and construct from
,
called the origin, and construct from
![]()
 an initial ray called the polar axis. Then each point
![]()
 in the plane can be assigned polar coordinates
![]()
 as follows.
![]()
 directed distance from
![]()
 to
to
![]()

![]()
 directed angle, counterclockwise from polar axis to
segment
directed angle, counterclockwise from polar axis to
segment
![]()

With rectangular coordinates,
each point
![]()
 has a unique representation. This is not true with polar coordinates. For
instance, the coordinates
has a unique representation. This is not true with polar coordinates. For
instance, the coordinates
![]()
 and
and
![]()
 represent the same point. Also, because
![]()
 is a directed distance, the coordinates
![]()
 and
and
![]()
 represent the same point.
To establish the relationship between polar and rectangular coordinates, let
the polar axis coincide with the positive
![]()
 axis
and the pole with the origin. Because
axis
and the pole with the origin. Because
![]()
 lies on a circle of radius
![]()
 ,
it follows that
,
it follows that
![]()
 .
Moreover, for
.
Moreover, for
![]()
 ,
the definition of the trigonometric functions implies that
,
the definition of the trigonometric functions implies that
![]()
 ,
,
![]()
 ,
and
,
and
![]()
 .
That is, the polar coordinates
.
That is, the polar coordinates
![]()
 of a point are related to the rectangular coordinates
![]()
 of the point as follows.
![]()
 ,
,
![]()
 ,
,
![]()
 ,
and
,
and
![]()
 .
.
For the point
![]()
 ,
,
![]()
 and
and
![]()
 .
Thus the rectangular coordinates are
.
Thus the rectangular coordinates are
![]()
 .
.
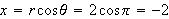
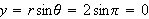
For the point
![]()
 ,
,
![]()
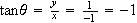 .
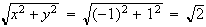
Thus,
.
Thus,
![]()
 (since the original point is in the second quadrant).
![]()

![]()
 .
Thus, one set of polar coordinates is:
.
Thus, one set of polar coordinates is:
![]()
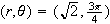 (recall that polar coordinates are not unique).
1. Convert the following rectangular coordinates to polar coordinates.
a.
![]()
 b.
b.
![]()

2. Convert the following polar coordinates to rectangular coordinates.
a.
![]()
 b.
b.
![]()

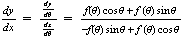
The following will be useful
for the next problem: If
![]()
 is
a differentiable function of
is
a differentiable function of
![]()
 ,
then the slope of the tangent line to the graph of
,
then the slope of the tangent line to the graph of
![]()
 at
the point
at
the point
![]()
 is
is
![]()
 provided
that
provided
that
![]()
 at
at
![]()
 .
.
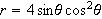
3. Graph the following polar equation and find all points of
horizontal tangency (that is, find the values of
![]()
 such that
![]()
 and
and
![]()
 ).
).
![]()
4. Graph the following polar equation. Find an interval for
![]()
 over which the graph is traced only once.
![]()

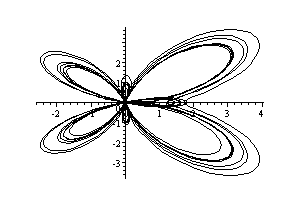
5. Graph the following polar equation so that you get the
curve depicted below. The curve is given by
![]()
 .
Over what interval must
.
Over what interval must
![]()
 vary to produce the curve?
6. Heart to Bell Graph the polar
equation
![]()
 for
for
![]()
 for the integers
![]()
 to
to
![]()
 .
What values of
.
What values of
![]()
 produce the "heart" portion of the curve? What values of
![]()
 produce the "bell"?
The following will be useful
for the next problem: If
![]()
 is
continuous and nonnegative on the interval
is
continuous and nonnegative on the interval
![]()
![$[\alpha ,\beta ]$](3b10__69.png) ,
then the area of the region bounded by the graph of
,
then the area of the region bounded by the graph of
![]()
 between
the radial lines
between
the radial lines
![]()
 and
and
![]()
 is
given by
is
given by
![]()

![]()

![]()
 .
.
7. Graph the following polar equation and find the area of the indicated region.
a. Inner loop of
![]()
 .
.
b. Between the loops of
![]()

c. Inside
![]()
 and outside
![]()
