Geography 103: Weather
Exercise 2C. Hourly weather records from CSUN
There is a link to the CSUN weather station data from the
geography home page at http://www.csun.edu/geography/
Current hourly weather records from the CSUN station can be
found by following this link, selecting “Weather
Station” and then “Current Weather Conditions
at CSUN”.
Past weather data is stored in Excel files and can be
accessed through this class web page (Weather
Data).
In Exercise 2B you plotted the temperature and solar
radiation data for June 23, 2002
on the same plot using Excel. In this
exercise you will plot the temperature and the relative humidity together, and
see how they vary relative to each other throughout the day. After opening up the weather data file in
Excel, you should select the plotting icon (“Chart Wizard”) and then choose
“Custom Types” followed by “Lines on 2 Axes”.
This allows you to use the left axis for temperature and the right axis
for humidity with two different scales.
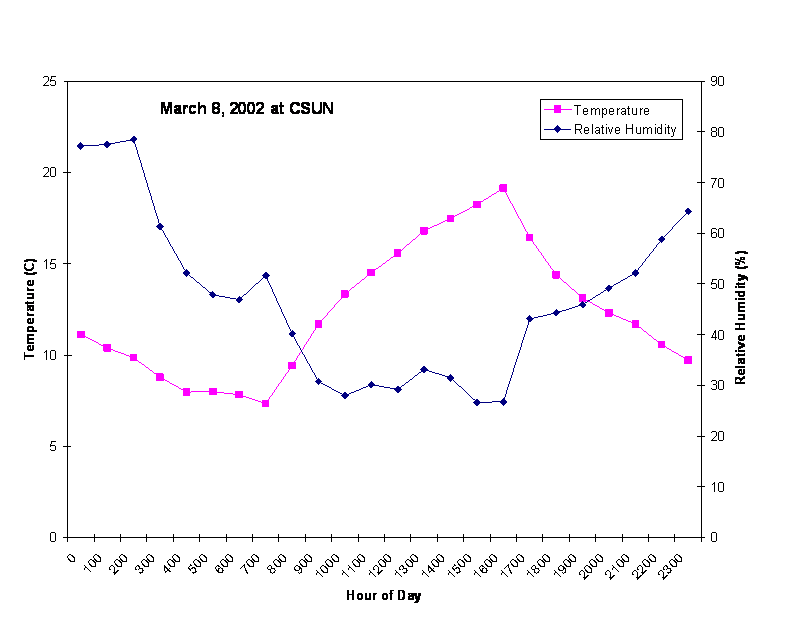
You can name one series “Temperature” and the other “Relative
Humidity”. Format your chart like the
example shown below for March 8, 2002.
Using your graph for June
23, 2002, what can you say about how the relative humidity varies
relative to the temperature? Why? When is the relative humidity lowest? Why?
When is it highest? Why?