
| Expenditures | Amount |
|---|---|
| Direct Cost | $16,160,757 |
| Indirect Cost | $2,289,204 |
| Total | $18,449,961 |
| Indirect Cost | Percent |
|---|---|
| Recovered Indirect Cost in % of Direct Cost | 14.2% |
| FY 2007/2008 - Period 1-12 - July 1 2007 - June 30, 2008 | Current Year FY 2007/2008 | Previous Year FY 2006/2007 | |||||||
| Actual vs. Budget | Annual Budget | Same Period | |||||||
| Actual | Budget | Diff. | Budget | Achiev. | Actual | Diff. | |||
| ($000) | ($000) | ($000) | in % | ($000) | in % | ($000) | ($000) | in % | |
| 1. Sponsored Programs Activity | |||||||||
| 1.1Direct Cost | 16,160 | 15,315 | 845 | 6% | 15,315 | 106% | 15,460 | 700 | 5% |
| 1.2Indirect Cost | 2,289 | 1,685 | 604 | 32% | 1,685 | 136% | 2,048 | 241 | 14% |
| 1.3Total SP-Cost | 18,449 | 17,000 | 1,449 | 9% | 17,000 | 109% | 17,508 | 941 | 6% |
| 2. Indirect Cost Rate | |||||||||
| 2.1Average IDC-Rate | 14.2% | 11.0% | 11.0% | 13.2% | |||||
| 3. Net Available to Campus | |||||||||
| 3.1Recovered IDC (=1.2) | 2,289 | 1,685 | 604 | 36% | 1,685 | 136% | 2,048 | 241 | 14% |
| 3.2- TUC-Service Fee (3.9%) | 720 | 663 | 57 | 9% | 663 | 109% | 683 | 38 | 6% |
| 3.3- Expense Dept. 24100 | 430 | 472 | -42 | -9% | 472 | 91% | 414 | ||
| 3.4- Expense Dept. 24150 | 85 | 91 | -6 | -7% | 91 | 93% | 87 | ||
| 3.5- Add. SP Reserve (10%) | 105 | 46 | 60 | 130% | 46 | 230% | 86 | ||
| 3.6 =Net Available to Campus | 949 | 413 | 536 | 130% | 413 | 230% | 778 | 171 | 18% |
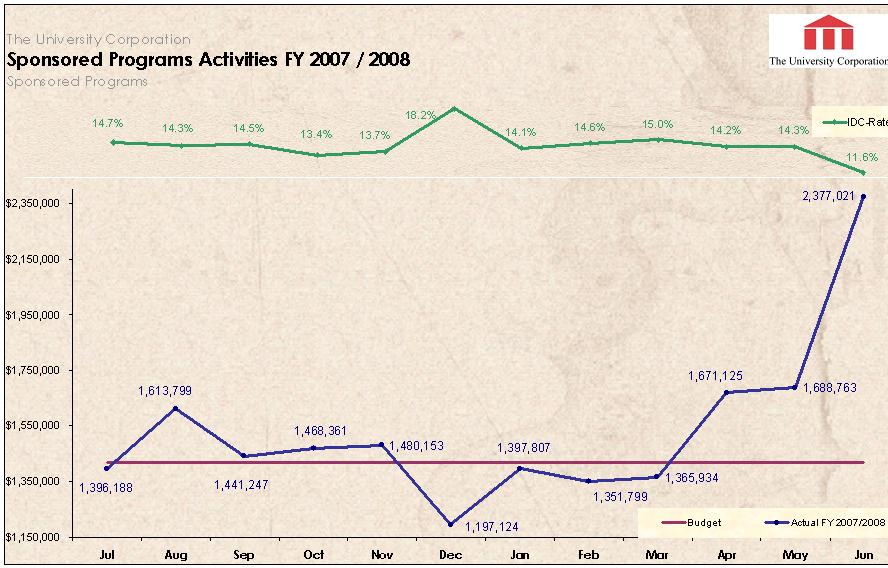
| Monthly Expenditures, FY 2007/2008 | July | August | September | October | November | December | January | February | March | April | May | June | Total |
|---|---|---|---|---|---|---|---|---|---|---|---|---|---|
| Actual | |||||||||||||
| Direct | 1,216,758 | 1,411,512 | 1,258,335 | 1,295,230 | 1,301,560 | 1,012,398 | 1,225,015 | 1,179,827 | 1,187,965 | 1,462,990 | 1,477,765 | 2,131,402 | 16,160,757 |
| Indirect | 179,430 | 202,287 | 182,912 | 173,131 | 178,593 | 184,726 | 172,792 | 171,972 | 177,969 | 208,135 | 210,998 | 246,258 | 2,289,204 |
| Total | 1,396,188 | 1,613,799 | 1,441,247 | 1,468,361 | 1,480,153 | 1,197,124 | 1,397,807 | 1,351,799 | 1,365,934 | 1,671,125 | 1,688,763 | 2,377,662 | 18,449,961 |
| IDC-Rate | 14.7% | 14.3% | 14.5% | 13.4% | 13.7% | 18.2% | 14.1% | 14.6% | 15.0% | 14.2% | 14.3% | 11.6% | 14.2% |
| Budget | 1,416,666 | 1,416,666 | 1,416,666 | 1,416,666 | 1,416,666 | 1,416,666 | 1,416,666 | 1,416,666 | 1,416,666 | 1,416,666 | 1,416,666 | 1,416,674 | 17,000,000 |
| Difference | -20,478 | 197,133 | 24,581 | 51,695 | 63,487 | -219,546 | -18,859 | -64,867 | -50,732 | 254,459 | 272,097 | 960,988 | 1,449,961 |
| Original Source of Funds | Direct Cost | Indirect Cost | Percent | Total | Percent |
|---|---|---|---|---|---|
| Federal Government (including pass-through from non-federal grantors) | 12,942,054 | 1,978,047 | 86.4% | 14,920,101 | 80.9% |
| State Government | 665,259 | 87,374 | 3.8% | 752,632 | 4.1% |
| Local Government | 1,637,241 | 115,215 | 5.0% | 1,752,456 | 9.5% |
| Private Non-Profit | 797,239 | 96,721 | 4.2% | 893,961 | 4.8% |
| Private For-Profit | 73,370 | 6,361 | 0.3% | 79,731 | 0.4% |
| Other | 45,595 | 5,485 | 0.2% | 51,080 | 0.3% |
| Total | 16,160,757 | 2,289,204 | 100.0% | 18,449,961 | 100.0% |
| Orginal Source of Funds - By Agency (including pass-through from non-federal grantors) | Total | Percent |
|---|---|---|
| US Department of Health and Human Services (DHHS) | 10,463,183 | |
| US Department of Education (ED) | 4,512,351 | |
| National Science Foundation (NSF) | 2,732,728 | |
| US Department of Justice (DOJ) | 420,855 | |
| US Department of Defense (DOD) | 512,264 | |
| Corporation for National and Community Service | 285,154 | |
| US Department of Labor (DOL) | 21,212 | |
| US Department of Energy (DOE) | 252,541 | |
| US Department of Agriculture (USDA) | 9,150 | |
| National Aeronautics and Space Administration (NASA) | 100,533 | |
| National Endowment for the Humanities | 20,000 | |
| US Department of Commerce (DOC) | 30,774 | |
| US Agency for International Development (USAID) | 32,360 | |
| US Department of the Interior (DOI) | 7,207 | |
| US Department of Treasury | 25,878 | |
| US Department of Transportation | 3,188 | |
| Total Federal Funds | ||
| State | ||
| Other | ||
| Total |