EKG Probe
SED 695B; Fall 2005
Research Question:
What are the effects of various body positions and food items on the electrical impulses of the heart as recorded by an EKG probe.
INTRODUCTION TO
EKG PROBE INSTRUMENTATION
Standards addressed:
SEVENTH GRADE LIFE SCIENCE
Structure and Function
5. b. Students know organ systems function because of the contributions of individual organs, tissues, and cells. The failure of any part can affect the entire system.
Physical Principles
6. j. Students know that contractions of the heart generate blood pressure and that heart valves prevent back flow of blood in the circulatory system.
BIOLOGY
Physiology
9. a. Students know how the complementary activity of major body systems provides cells with oxygen and nutrients and removes toxic waste products such as carbon dioxide.
9. b. Students know how the nervous system mediates communication between different parts of the body and the body's interactions with the environment.
___Time in Seconds ___________Voltage of the _____________________________Myofibers
____________________________of the Heart
Normal Diet
-
Standing
-
Lying
-
Running in Place
-
Consumption of Ca ("Tums")
-
Consumption of Caffeine ("Red Bull")
-
Consumption of Potassium (bananas)
Electrode Placement
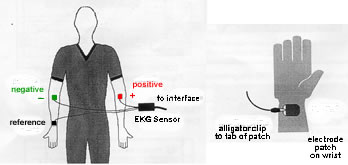
Record EKG under the following conditions:
-
Sitting
-
Standing
-
Running in place
-
After consumption of calcium
-
After consumption of caffeine
-
After consumption of potassium

This sample table demonstrates how students can measure and record the heart beats per minute, height (in voltage) and time (in seconds) of P waves, T waves, and the QRS complex for their chosen investigation. Each team can do a resting measurement and then compare that to various positions and consumption of food items.
The class can then compare their EKG data with the other team investigations and draw conclusions.
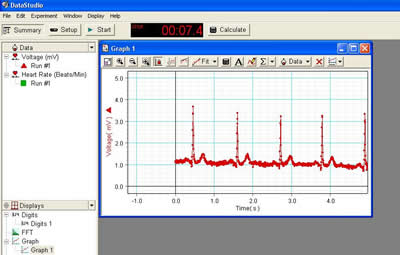
Data Studio allows the students to collect EKG data.
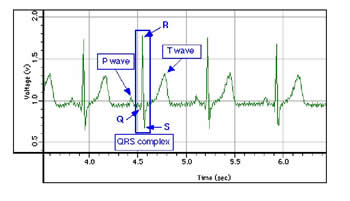
They can measure their heart rates and the voltages of the:
- P wave - which represents depolarization of the atria.
- QRS wave - which is depolarization of the ventricles (repolarization of the atria is masked by this wave).
- T wave - which represents repolarization of the ventricles.
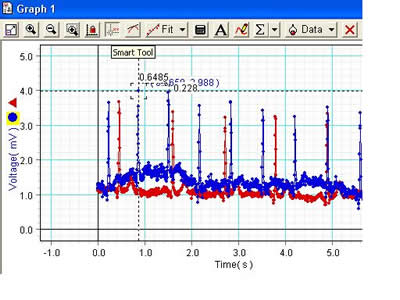
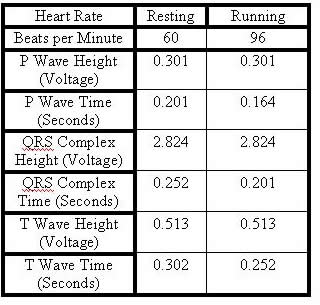
Here is a sample data table with sample data.
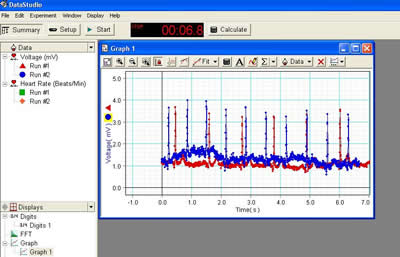
A comparison can be made between the student's resting EKG and after running in place. Notice that the voltage for each wave has not changed, but the time for each wave has decreased.
The same student could then rest and lay down, or eat a food containing something that may affect the EKG.
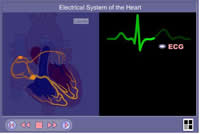
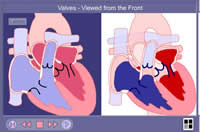
This video clip also shows another view of the electrical impulses of a beating heart. Illustration of the impulse from the sinoatrial node in the right atrium to the atrial ventricular node, down the Bundle of His to the Purkinje fibers of the ventricles.
MCDB at the University of Colorado at Boulder
References & Links:
Molecular Cellular and Developmental Biology at the University of Colorado at Boulder