Modeling a Predator/Prey Population Study |
||
Author(s): Jon Fisher | Growth & Development Experiment
SED 695B; Fall 2005 |
Research Question: 
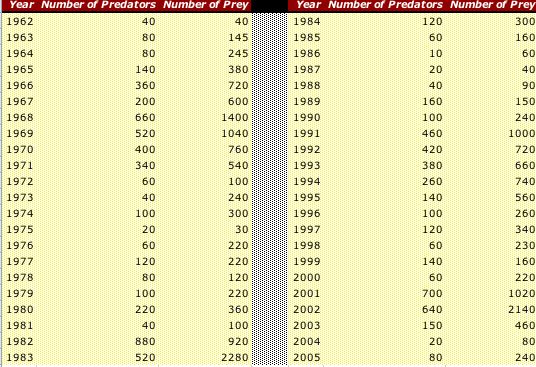
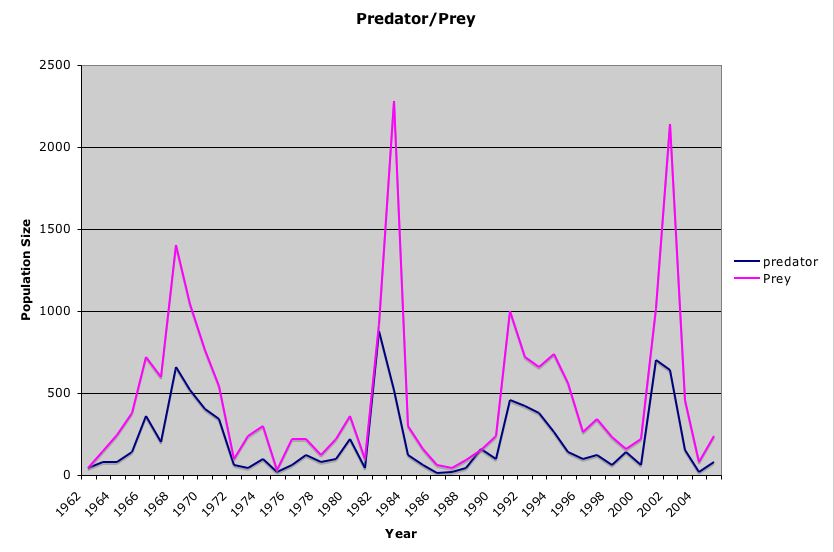
How do populations of predators and prey change over time?
|
|||
Standards addressed: 6th grade science: 5e. Students know the number and types of organisms an ecosystem can support depends on the resources available and on abiotic factors, such as quantities of light and water, a range of temperatures, and soil composition. Biology 6c. Students know how fluctuations in population size in an ecosystem are determined by the relative rates of birth, immigration, emigration, and death. 6th Grade Math 2.0 Students use data samples of a population and describe the characteristics
and limitations of the samples: |
Independent variable |
Dependent variables |
Controls |
Series |
population of predator and prey | none | time |
Materials |
Procedures |
||
*the newspapers are pre-sorted and labeled by the teacher to create population flux.
|
1. Each student will be given a piece of newspaper with a
year written on top. A ruler and a colored pencil. 2. In the middle of each newspaper page the student should draw a 10” x 10” grid. This grid will represent the study area (full of mice and hawks) for our hypothetical forest. 3. Label the boxes along the horizontal axis A-J. Label the boxes along the vertical axis 1-10. 4. We have now labeled the grid for our population study. 5. In the study area delineated by the grid, we will be counting the number of mice (prey) and hawk (predator) we find. The letter “e” will represent the prey (mouse), and the letter “l” will represent the predator (hawk). Count only the squares the teacher has randomly selected. (you could count all of them, but sampling saves you time.) 6. Enter the number of hawks and mice you count in each of the randomly pre-selected square areas onto individual data table. 7. Add up the total number of predator and prey that you counted in the entire field of study. Divide the total number of predator by 25 (to get the squares in the study area). In order to get the estimated total number of predators in the hypothetical forest that year. 8. Repeat step 7 for the prey. 9. Give the teacher your data obtained in steps 7-8. The teacher will prepare the class data table. 10. Use the class data to plot a graph of predators and prey vs. time. 11. Answer the discussion questions. |
||
Sample Discussion Questions
|
Description | |||
The data can be manipulated by the instructor by making "high" population years more or less frequent or even non-cyclical. | |||
This data mimmics the real population data collected in the field (see links below), with the exception of the lag time between predator peaks and prey peaks -a flaw in the system and a teachable moment. | |||
|
|||
References & Links: A presentation on population studies and sampling |