Does Plant Density Affect Plant Growth?
Growth
& Development Experiment
SED 695B; Fall 2005
SED 695B; Fall 2005
Research Question:
How does an increase in population density affect plant growth?
Standards addressed:
Biology:
6. Stability in an ecosystem is a balance between competing effects. As a basis for understanding this concept:
a.
Students know biodiversity is the sum total of different kinds of organisms and is affected by alterations of habitats. b.
Students know how to analyze changes in an ecosystem resulting from changes in climate, human activity, introduction of nonnative species, or changes in population size. d.
Students know how water, carbon, and nitrogen cycle between abiotic resources and organic matter in the ecosystem and how oxygen cycles through photosynthesis and respiration. e.
Students know a vital part of an ecosystem is the stability of its producers and decomposers.
Independent variable
Dependent
variables
Controls
Series
Seed Density
Amount of Water
Plant Color
Materials
Procedures
- Cups
- Soil
- Radish Seeds
- Water
- Balance
- Fill 5 cups with an equal amount of soil. It may be helpful to use a plant starter kit.
- Label the cups 1 Radish seed, 2 Radish seeds, 4 Radish seeds, 8 Radish seeds, and 16 Radish seeds.
- Equally distribute the number of seeds indicated in each cup.
- Water each cup with an equal amount of water.
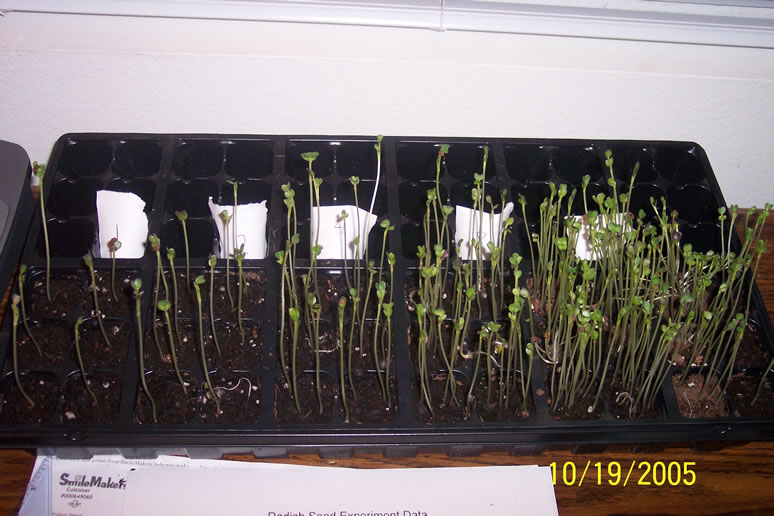
- Each day, take a picture of the plants, and record any observations you notice (height, color, etc.)
| Plant Height Data | ||||
| Number of Plants | Average Plant Height (cm) | |||
| Day 1 | Day 2 | Day 3 | Day 4 | |
| 1 | ||||
| 2 | ||||
| 4 | ||||
| 8 | ||||
| 16 | ||||
| Plant Growth Data | ||||
| Number of Plants | Average Plant Growth (cm) | |||
| Day 2 | Day 3 | Day 4 | Day 5 | |
| 1 | ||||
| 2 | ||||
| 4 | ||||
| 8 | ||||
| 16 | ||||
| Plant Height Data | ||||||||||
| # of Seeds | Average Plant Height (cm) | |||||||||
Day 1 |
Day
2 |
Day
3 |
Day
4 |
Day
5 |
Day
6 |
Day
7 |
Day
8 |
Day
9 |
Day
10 |
|
1 |
0.00 |
0.00 |
0.00 |
1.72 |
4.37 |
7.97 |
10.30 |
11.90 |
12.45 |
13.13 |
2 |
0.00 |
0.00 |
0.80 |
2.99 |
5.50 |
8.49 |
10.09 |
11.04 |
11.45 |
12.08 |
4 |
0.00 |
0.00 |
0.00 |
2.86 |
6.16 |
8.95 |
11.04 |
12.02 |
12.76 |
13.63 |
8 |
0.00 |
0.00 |
0.00 |
2.88 |
5.08 |
8.30 |
9.79 |
11.17 |
11.40 |
12.00 |
16 |
0.00 |
0.00 |
0.00 |
3.13 |
5.77 |
8.80 |
10.17 |
11.50 |
11.80 |
12.20 |
| Plant Growth Data | ||||||||||
| # of Seeds | Average Plant Growth (cm) | |||||||||
Day 1 |
Day
2 |
Day
3 |
Day
4 |
Day
5 |
Day
6 |
Day
7 |
Day
8 |
Day
9 |
Day
10 |
|
1 |
N/A |
0.00 |
0.00 |
1.72 |
2.65 |
3.60 |
2.33 |
1.60 |
0.55 |
0.68 |
2 |
N/A |
0.00 |
0.80 |
2.19 |
2.51 |
2.99 |
1.60 |
0.95 |
0.41 |
0.64 |
4 |
N/A |
0.00 |
0.00 |
2.86 |
3.30 |
2.79 |
2.09 |
0.98 |
0.73 |
0.88 |
8 |
N/A |
0.00 |
0.00 |
2.88 |
2.19 |
3.23 |
1.49 |
1.37 |
0.23 |
0.60 |
16 |
N/A |
0.00 |
0.00 |
3.13 |
2.63 |
3.03 |
1.37 |
1.33 |
0.30 |
0.40 |
References & Links: